
A Mixed Morning for Grain Markets
Posted: Aug. 31, 2023, 7:24 a.m.
CornNews
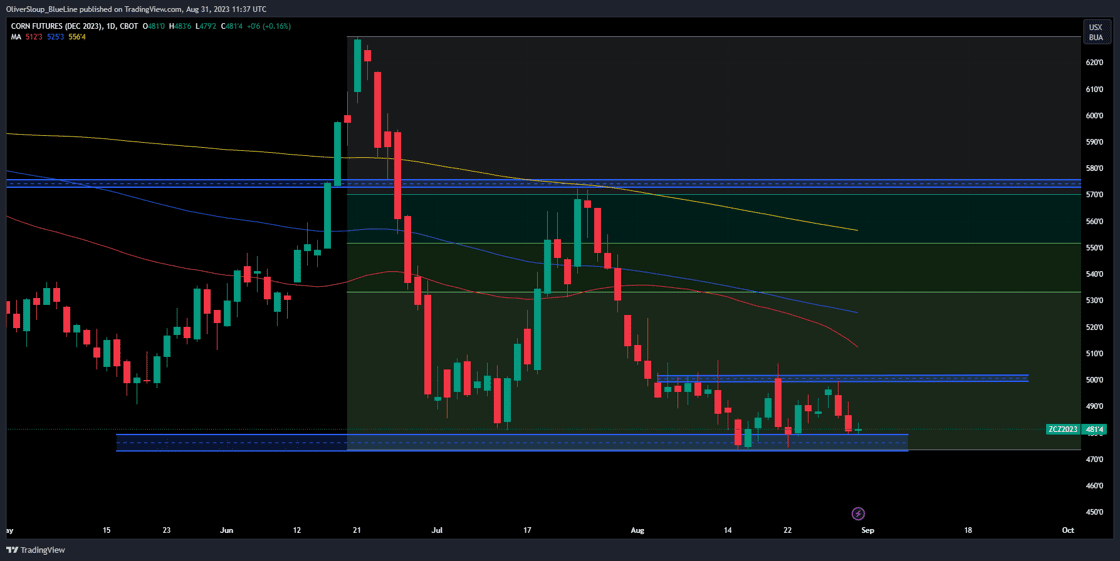
Technicals (December)December corn futures attempted to rally yesterday but fell flat into the afternoon session, closing near the lows of the day. 472-476 is the support pocket the Bulls must defend. A break and close below that pocket could accelerate the selling pressure. On the flip side, 489-491 is our pivot pocket. If the Bulls can muster up the energy to get out and close above this pocket it could reinvigorate buyers and take us back towards the upper end of the recent range, 502-506 1/2. As mentioned in yesterday's commentary, we wouldn't be surprised to see a choppy sideways trade in the near term. Not a great environment for perma-bulls or perma-bears, but great for shorter term trading opportunities on both sides of the market. Bias: Neutral Resistance: 497 1/2**, 502-506 1/2***, 518-525 3/4**** Pivot: 489-491 Support: 472-476****, 460-464 1/2** |
 |
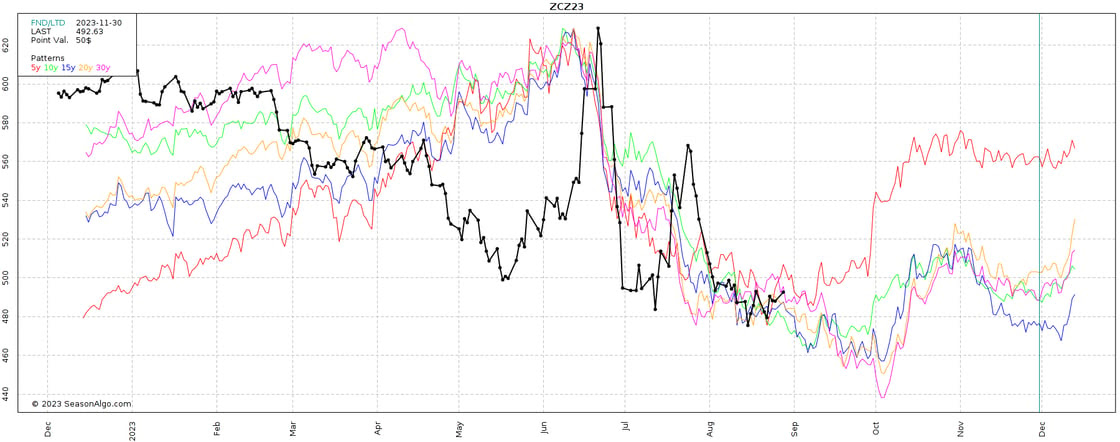
Seasonal TendenciesBelow is a look at seasonal averages for December corn. The 5-year seasonal average suggests seasonal consolidation while longer term averages continue to trend lower into harvest. |
 |
Soybeans |
|
News
Technicals (November)November soybeans traded lower yesterday and overnight, testing and defending our 4-star support pocket from 1373-1381. This pocket represents previously important price points including the old gap from July 31st. From a risk/reward perspective, we feel this pocket represents a good opportunity to the buy-side, whether that be initiating longs or covering shorts. A break and close below that pocket would neutralize that bias as it could open the door for long liquidation and a retest of trendline support and two major moving averages. A close back above 1390 1/2-1392 could be what reinvigorates the Bull camp. Bias: Bullish/Neutral Resistance: 1409 1/2**, 1428-1435**** Pivot: 1390 1/2-1392 Support: 1373-1381****, 1350-1355*** |
 |
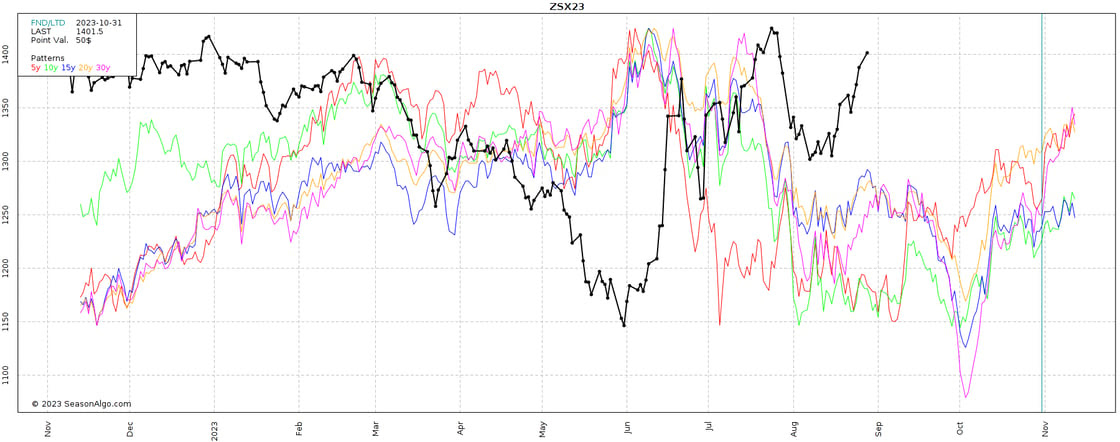
Seasonal TendenciesBelow is a look at seasonal averages for November soybeans. We've noted in previous reports that seasonal tendencies suggest this is a time of year where the market attempts to consolidate and carve out a near term low. |
 |
WheatNews
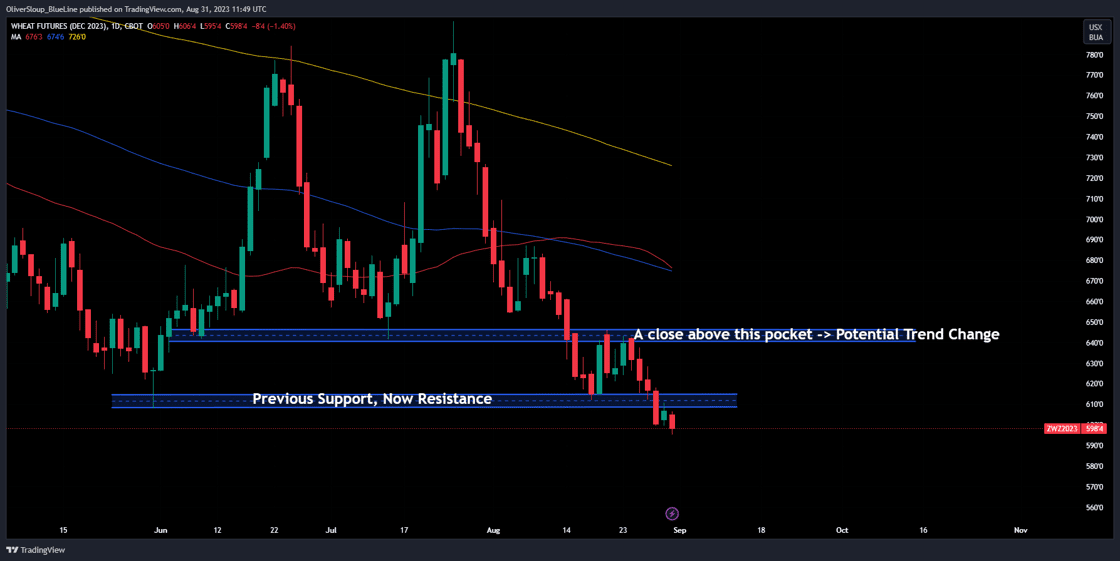
Technicals (December)Wheat futures are higher in yesterday's trade but have given it back and made new lows in the early morning trade. The market has been under enormous amount of pressure since marking a double top back on July 25th. In those following 25 trading sessions wheat fell as much as $1.78 with very few attempts at a relief rally in-between. Bias: Neutral/Bullish Resistance: 643 1/2-646 1/4****, 677 1/4-682 1/4*** Pivot: 608 1/4-612 Support: 595-599 1/2** |
 |
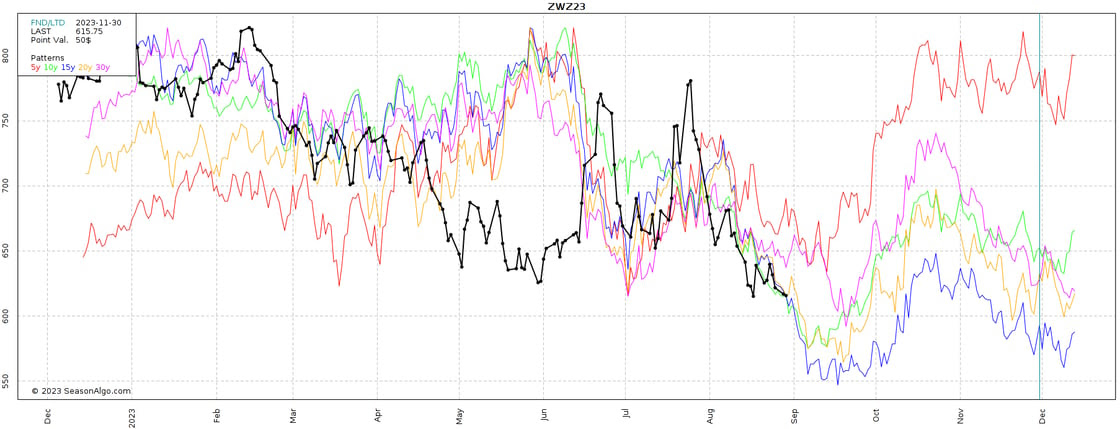
Seasonal TendenciesBelow is a look at seasonal averages for December Chicago wheat. The market is tracking the 15-year average the most closely (blue line), which suggests lower into the middle of September. The more recent 5-year average (red line) shows that consolidation has been happening earlier, which may help the market start to carve out a low against that May 31st low, 608 1/4. |
 |
In case you haven't already, you can sign up for a complimentary 2-week trial of our complete research packet, Blue Line Express.
Sign up for a Free Trial
Start Trading with Blue Line Futures
Don't have an account with Blue Line Futures?
Futures trading involves substantial risk of loss and may not be suitable for all investors. Therefore, carefully consider whether such trading is suitable for you in light of your financial condition. Trading advice is based on information taken from trade and statistical services and other sources Blue Line Futures, LLC believes are reliable. We do not guarantee that such information is accurate or complete and it should not be relied upon as such. Trading advice reflects our good faith judgment at a specific time and is subject to change without notice. There is no guarantee that the advice we give will result in profitable trades. All trading decisions will be made by the account holder. Past performance is not necessarily indicative of future results.
Blue Line Futures is a member of NFA and is subject to NFA’s regulatory oversight and examinations. However, you should be aware that the NFA does not have regulatory oversight authority over underlying or spot virtual currency products or transactions or virtual currency exchanges, custodians or markets. Therefore, carefully consider whether such trading is suitable for you considering your financial condition.
With Cyber-attacks on the rise, attacking firms in the healthcare, financial, energy and other state and global sectors, Blue Line Futures wants you to be safe! Blue Line Futures will never contact you via a third party application. Blue Line Futures employees use only firm authorized email addresses and phone numbers. If you are contacted by any person and want to confirm identity please reach out to us at info@bluelinefutures.com or call us at 312- 278-0500
Like this post? Share it below:
Back to Insights
In case you haven't already, you can sign up for a complimentary 2-week trial of our complete research packet, Blue Line Express.
Free Trial