Inflation & Growth Expectations, Terminal Fed Funds Rate, Deficit Financing | Top Things to Watch this Week
Posted: Dec. 11, 2022, 1:12 p.m.
Inflation & Growth Expectations, Terminal Fed Funds Rate, Deficit Financing
"The best cure for the body is a quiet mind." - Napoleon Bonaparte
Chart Booklet & Podcast
Access all of this week's charts used in today's writing and Macro Corner Episode 27: Chart Booklet
Check out last week's podcast episode on the Macro landscape: Macro Corner Podcast, Episode 26
Email podcast@bluelinefutures.com with any questions as it pertains to today's article or any Macro Corner podcast episode -- we are more than happy to discuss!
The Economy Is Renormalizing
Inflation Is Cooling (Much More Rapidly)
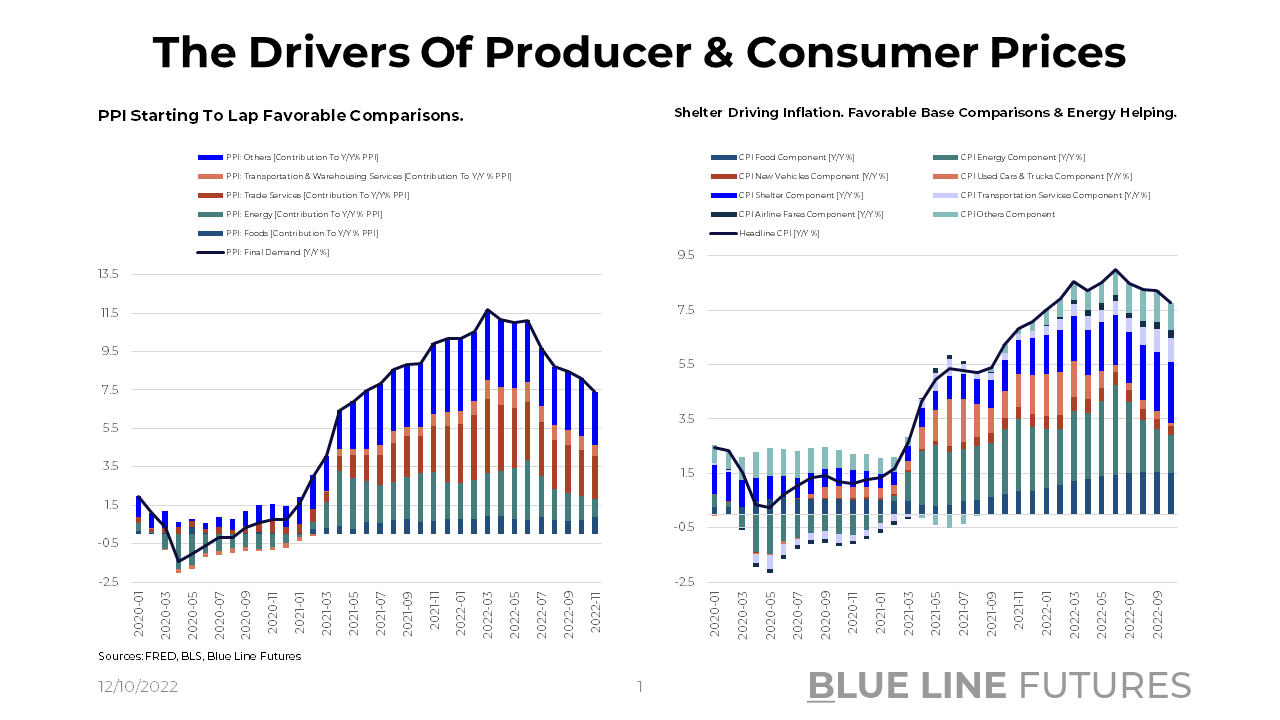
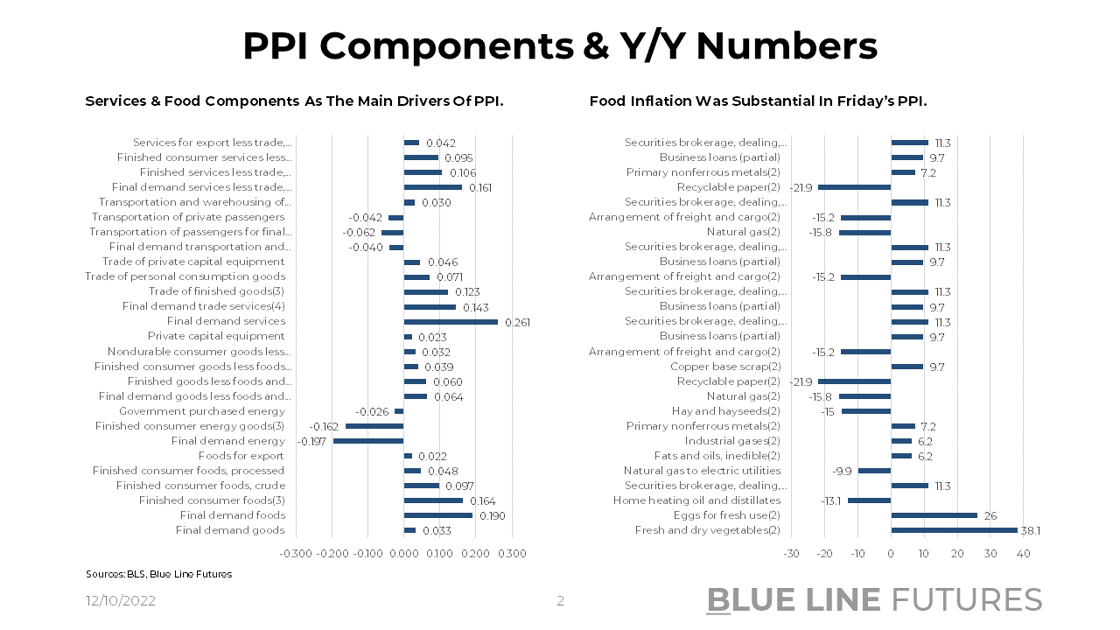
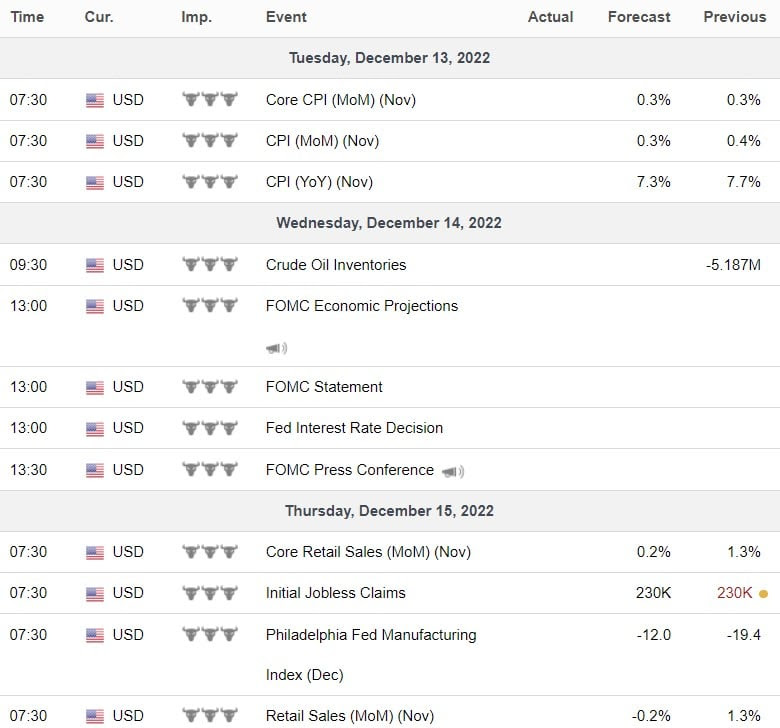
After PPI surprised to the upside at 7.4% Y/Y on Friday (+0.3% v. +0.2% exp. M/M; Core PPI +0.4% v. +0.2% exp. M/M), eyes are turning to CPI on Tuesday (exp. 7.3% Y/Y vs. 7.7% prev.) and the Fed on Wednesday. The Cleveland Fed Nowcast is estimating 7.49% Y/Y for November. The main drivers of both PPI and CPI continue to be heavy on the services side along shelter as the main component putting upward pressure on CPI. Final services demand alone contributed 0.261% to the 0.3% headline print of PPI. In contrast to a 2.5% M/M acceleration on the wage part of Nonfarm Payrolls in transportation & warehousing, final demand in transportation and warehousing contributed -0.04% to PPI. Acting on the disinflationary side, energy contributed -0.197% to the +0.3% headline, directly reflecting crude and oil products having deflated significantly. On the more surprising side, final demand for food added +0.19% to the monthly headline print with fresh and dry vegetables up 38.1% M/M. The inflation seen on the food side will be one to watch going forward as the CEO of Nestle indicated that full pass-through to the consumer has yet to occur.
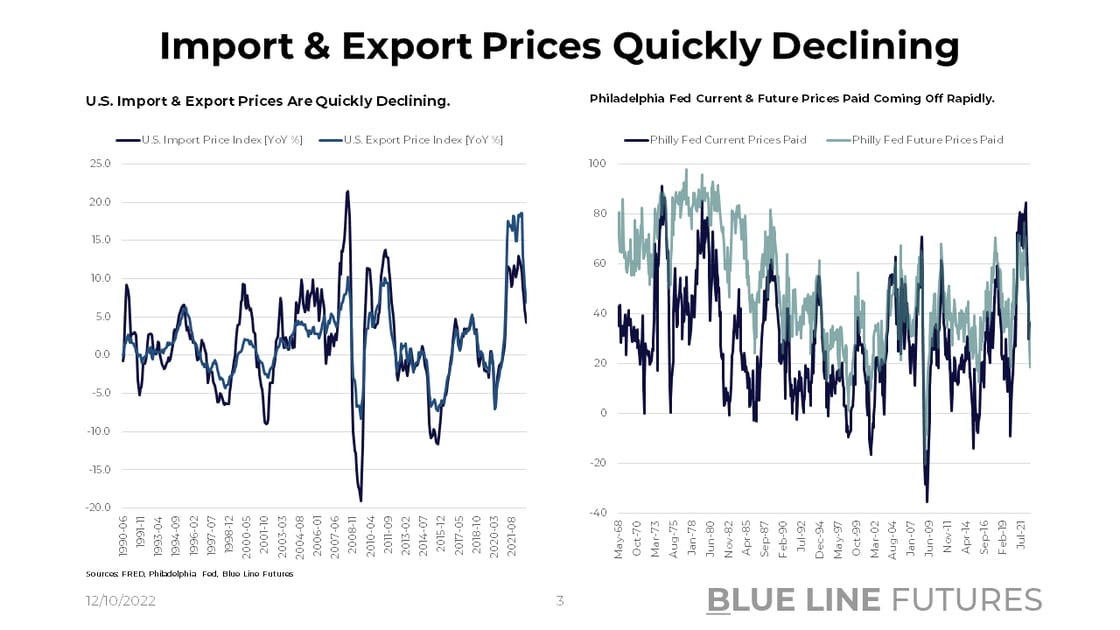
Deflating a lot more rapidly than headline inflation prints by themselves, import and export prices are falling off a cliff and doing so alongside prices paid in manufacturing rapidly declining. Y/Y import prices are down from 13.0% in March to 4.2% in October; export prices are down from 18.6% in May to 6.9% in October. A survey index by the Philadelphia Fed highlights the disinflation on the manufacturing side - also reflected in NFP job losses in manufacturing, - with the current prices paid index down from 84.6 in April to 35.3 in November; expectations for future prices paid are down from 76.4 in January to 18.5 in November.
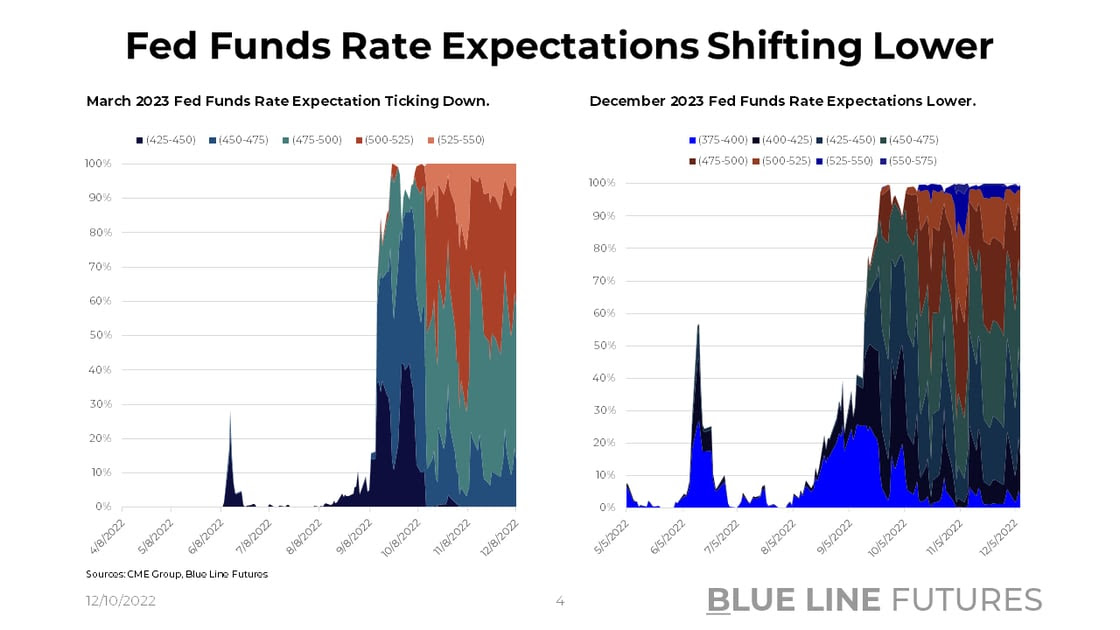
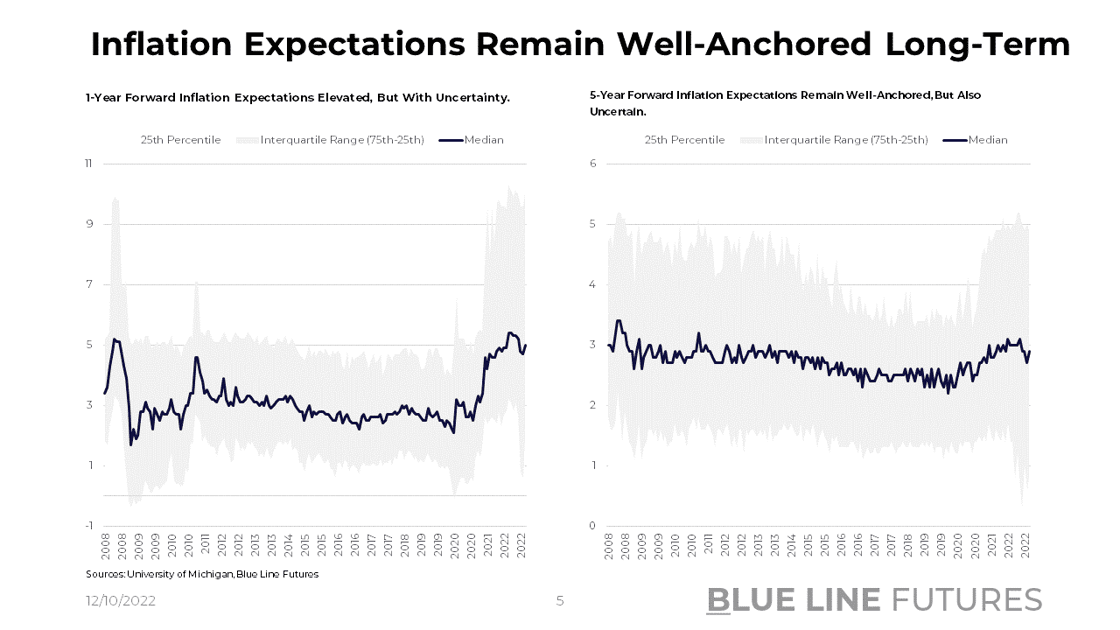
As a result of lead-lag relationships in inflation indices compiled by the Bureau of Labor Statistics, real-time indicators are important as they start pointing to less hawkish Fed policy. For one, we do know that the Fed aims to raise Fed Funds to 5%ish early next year and then stay relatively restrictive for as long as it takes. I thought one of the best ways of thinking about policy going forward is a framework mentioned by Liz Ann Sonders on Bloomberg: reporters and market participants alike will start to wonder about the Fed's milestones to 2% average inflation. As those key parameters get established, markets will increasingly shift the discussion. All of those ideas don't account for the possibility of a new normal driven by structural factors such as the ones I pointed to last week (Prospects For Future Growth).
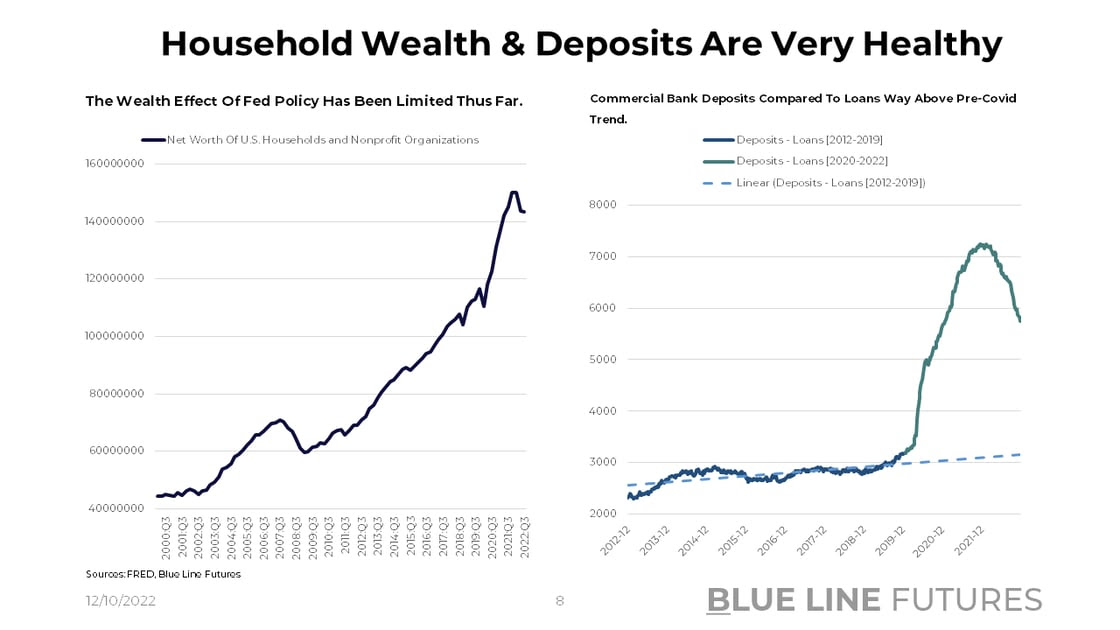
Despite inflation uncertainty remaining relatively high, it is clear that U.S. Households are in a very strong position in the aggregate. While there's been a lot of chatter around credit card debt increasing, we need to put things into perspective. The net worth of U.S. Households and Nonprofit Organizations has increased from $119 trillion in Q4 of 2019 to $143 trillion in Q3 of 2022. Echoing a rather healthy consumer, the difference between deposits & loans at commercial banks has increased from $3.18 trillion in December 2019 to $5.75 trillion as of November 2022 (off from $7.24 trillion in November 2021.) In comparison, revolving credit has increased from ~$739bn in April of 2021 to ~$939bn as of November 2022 -- a net delta of ~$200bn.
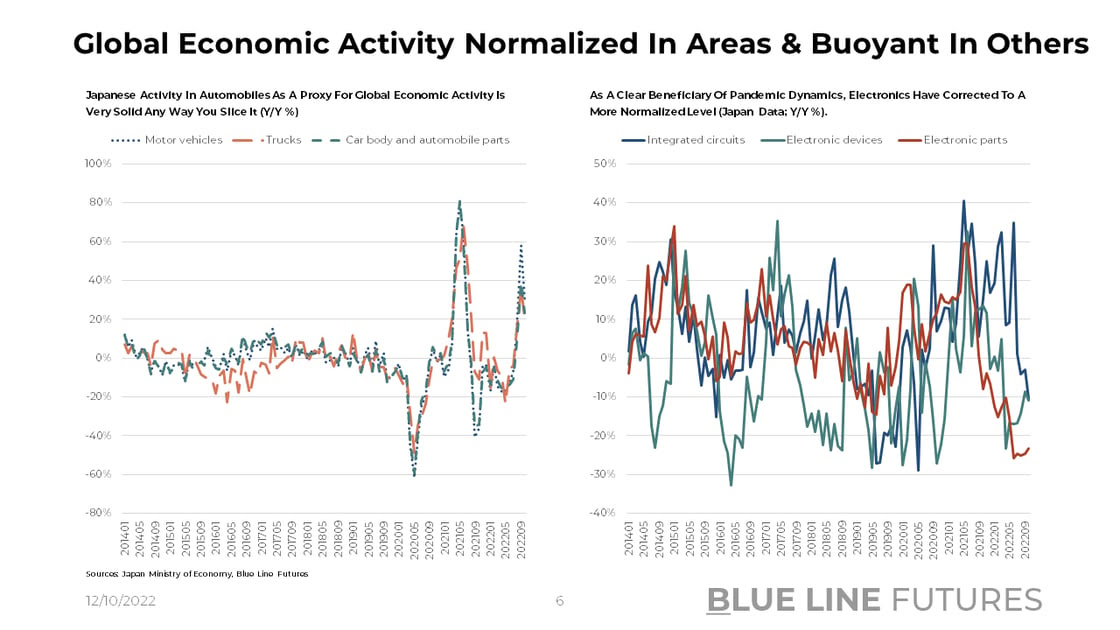
Amplifying the idea of returning to a less uncertain equilibrium, Japanese industrial activity as a proxy for global economic activity is pointing in a relatively favorable direction. Motor vehicle activity is up 30% Y/Y, trucks up 21% Y/Y, and motorcycles up 67%. Buoyant activity in cars & trucks stands in contrast with the industrial production of electronic devices and electronic parts down 11% and 23% Y/Y, respectively. Looking back, however, we all know that activity in electronics was extremely elevated as a result of Covid with people staying at home and revamping their work-from-home setup (lots of webcams, laptops, and other hardware was bought.)
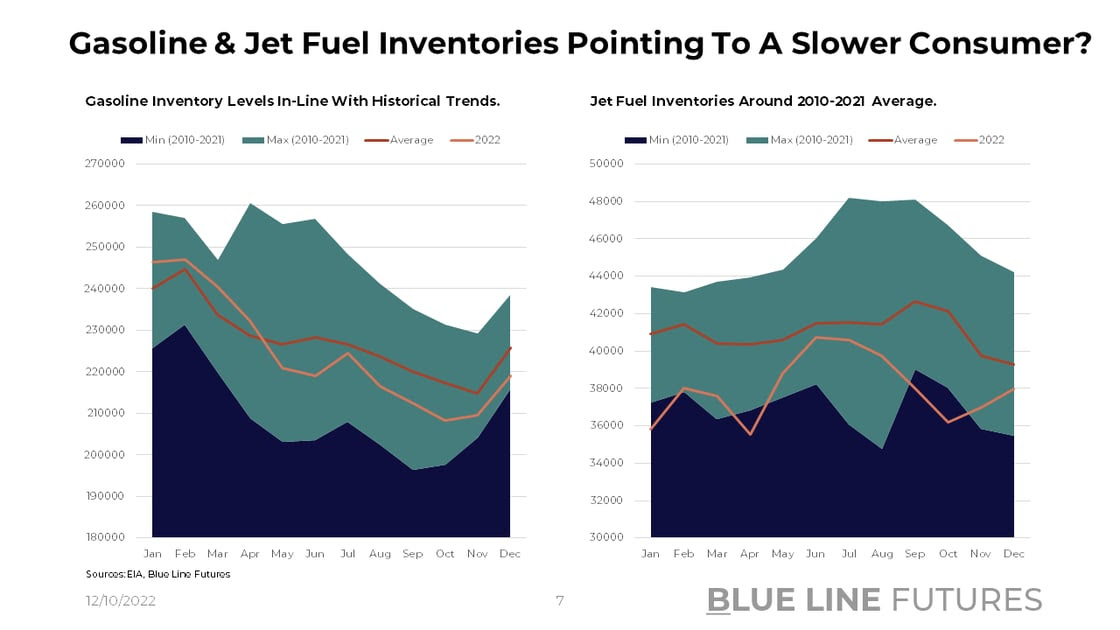
Connecting the dots between inflation, economic activity, and consumption, gasoline as well as jet fuel inventory levels are roughly in-line with 2010-2021 averages. Keep in mind, we've talked about constrained refinery capacity in the past, which indicates that demand has to be relatively weak to sustain average inventory levels; that in turn points to weaker consumer demand than services activity may suggest (or at least indicative of a slowdown.) Weaker product demand is also reflected in crack spreads that have come off from the highs but are elevated by historical standards.
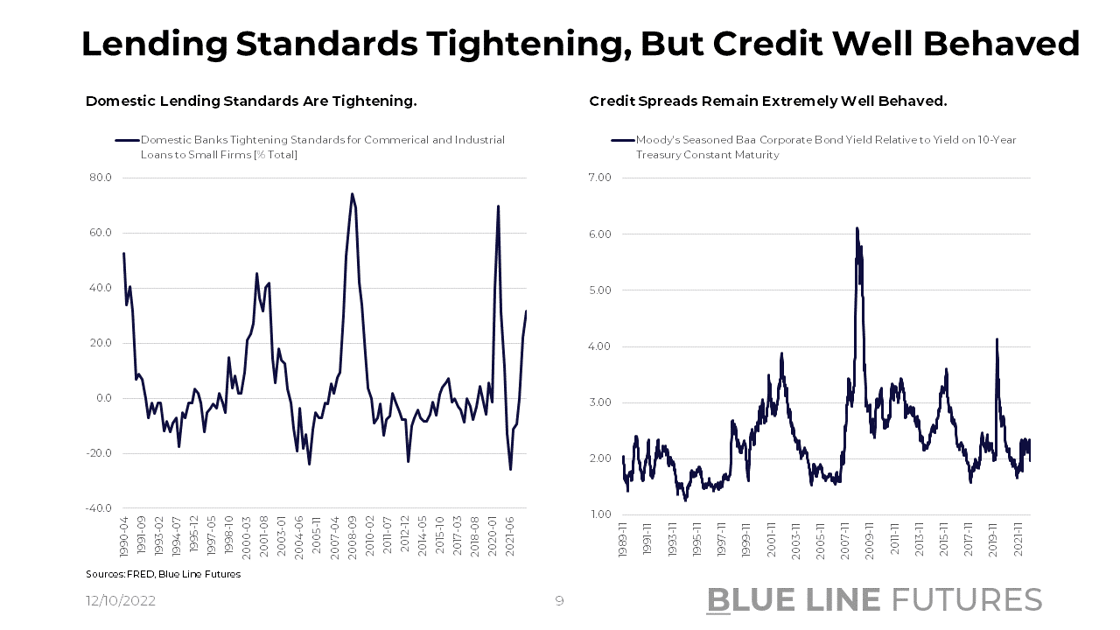
Another theme we've mentioned in the past is the tightening of credit markets with defaults expected to tick up as more maturities come due. Measuring domestic lending standards to small businesses, banks are becoming rather conscious of who they're willing to lend to. While the effects have not yet spilled over into broader credit spread dynamics, which have remained extremely well contained, the longer cost of capital stays high, the more questionable some business models will become.
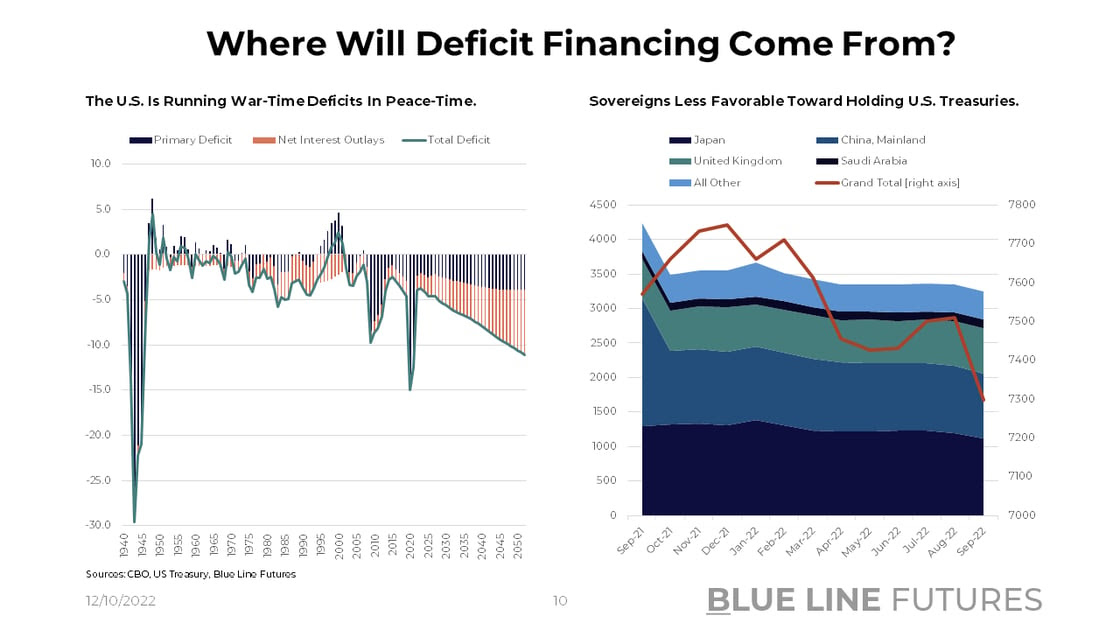
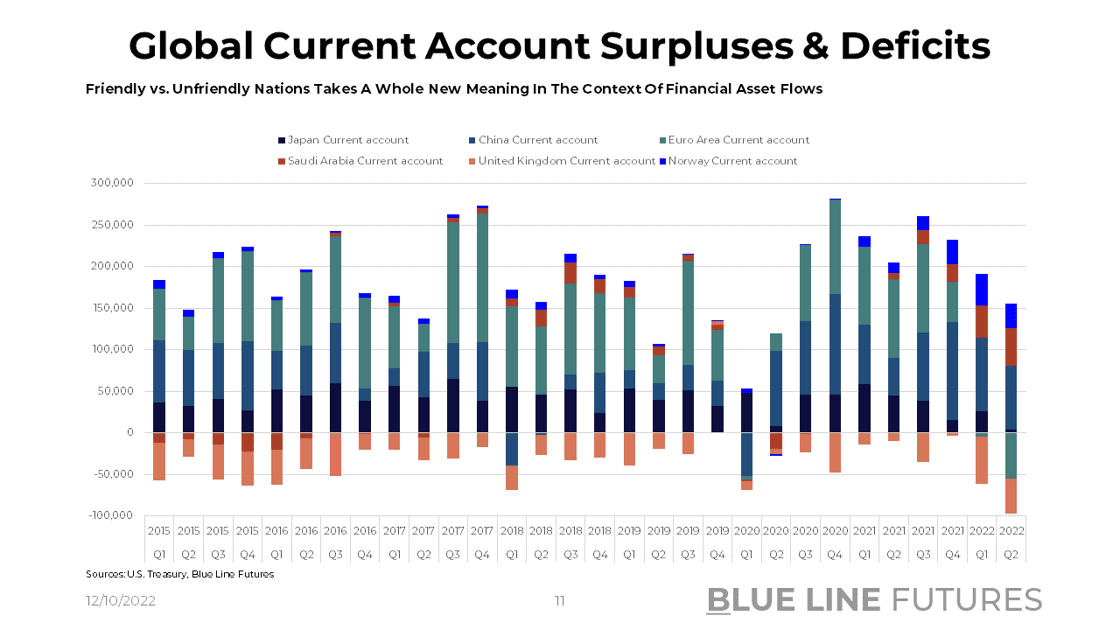
Lastly, I want to address two graphs included in the 'Food For Thought' section of today's article. Generally speaking, deficits are pointing nowhere but in the wrong direction as demographics deteriorate, healthcare costs increase, and productivity remains lackluster. As a result, the U.S. will aim to finance deficits via the treasury market, usually seen as the channel through which sovereigns recycle excess currency. Over the last year or so, however, countries like China and Saudi Arabia have decreased their treasury holdings despite running large surpluses. One driver is linked back to FX hedging becoming more expensive. Another aspect is deteriorating trust between nations that are now trying to diversify their currency reserves. While we still live in a world of Dollars on which most actors rely, some countries are less eager to recycle surpluses as a result of geopolitical dynamics.
Data & Commentary
Since I already introduced the ideas behind the graphs that follow, I will save you time and let the charts speak for themselves. All the graphs can be found here: Chart Booklet

Fixed Income has become that much more attractive as inflation has driven up yields. Equities have corrected, but remain at historically high multiples, especially when compared to foreign markets such as EM. Cash flowing assets are valued again while lottery tickets face more scrutiny in the due diligence process of investors. This may be regime change, but it may as well be a transitory period before returning to a low growth, low inflation environment. Right now the odds point to the former with tail risks such as higher for longer, another round of tightening, and cost of capital acting to the detriment of borrowers. Nevertheless, payoffs are a function of probabilities. The fact that I assign a higher probability to regime shift makes me question what I am missing. Is inflation going to overshoot the other way? Are globalization and therefore deflationary drivers going to surprise positively? The dots will clearly connect looking backward while not accounting for the fact that at each turn, there are many counterfactuals that were just as likely.
Until next time, good luck & good trading.
Be sure to check out prior writing of Top Things to Watch this Week:
- The Prospects For Future Growth - December 4, 2022
- Is This A Titanic Economy - November 20, 2022
- The U.S. Economic Cycle - November 13, 2022
Our Blue Line Futures Trade Desk is here to talk about positioning, idea and strategy generation, assisted accounts, and more! Don't miss our daily Research with actionable ideas (Click Here To Sign Up)
Schedule a Consultation or Open your free Futures Account today by clicking on the icon above or here. Email info@BlueLineFutures.com or call 312-278-0500 with any questions!
Economic Calendar
U.S.
Data Release Times (C.T.)
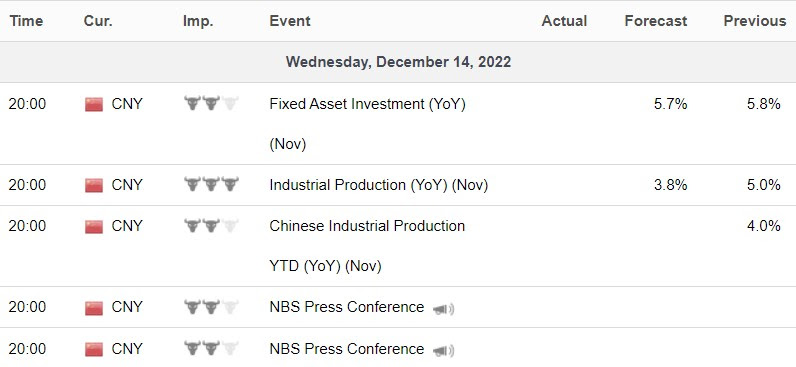
China
Data Release Times (C.T.)
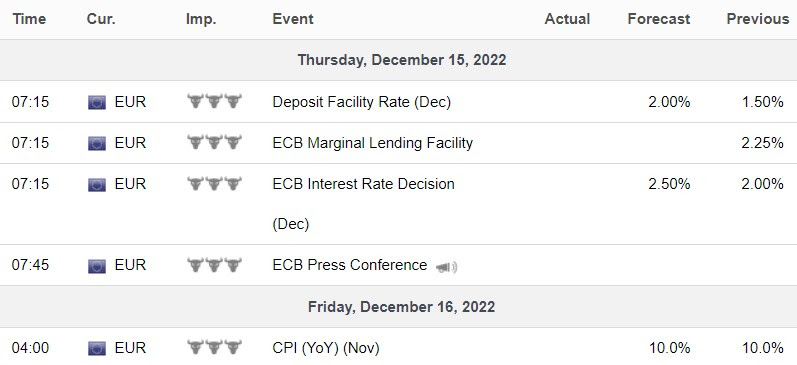
Eurozone
Data Release Times (C.T.)
More Of The Upcoming Economic Data Points Can Be Found Here.
Food for Thought
Earnings
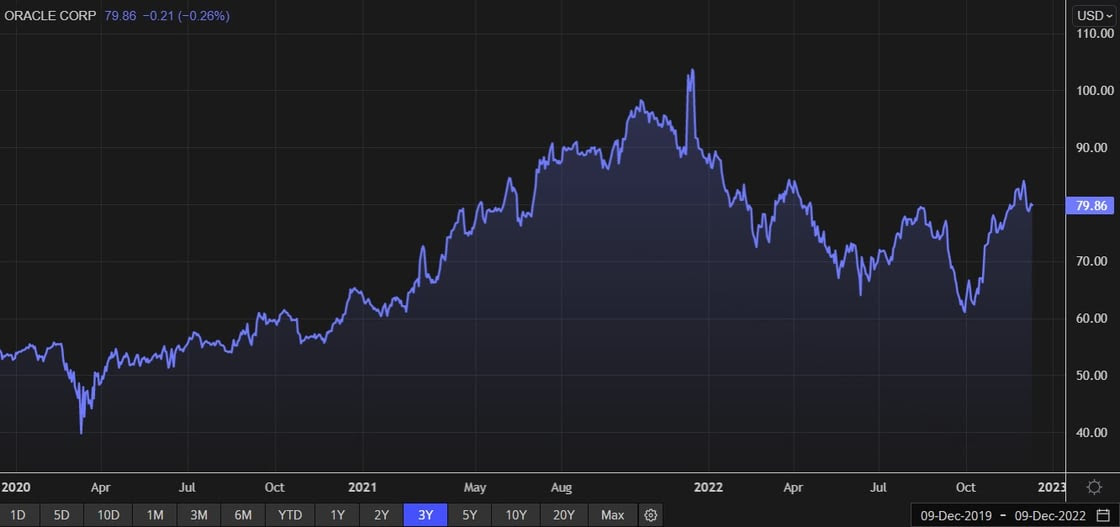
Oracle (ORCL) reporting after the close on Monday:
- Consensus: EPS est. $1.18; Revenue est. $12.04bn
Commentary on the following be monitored:
- Continuation of the cloud transition
- Health care trends and commentary on Cerner integration
Adobe (ADBE) reporting after the close on Thursday:
- Consensus: EPS est. $3.50; Revenue est. $4.53bn
Commentary on the following be monitored:
- Figma integration
- Adobe Cloud subscription revenue

Blue Line Capital
If you have questions about any of the earnings reports, our wealth management arm, Blue Line Capital, is here to discuss! Email info@bluelinecapllc.com or call 312-837-3944 with any questions! Visit Blue Line Capital's Website
Sign up for a 14-day, no-obligation free trial of our proprietary research with actionable ideas!
Free Trial
Start Trading with Blue Line Futures
Subscribe to our YouTube Channel
Email info@Bluelinefutures.com or call 312-278-0500 with any questions -- our trade desk is here to help with anything on the board!
Futures trading involves substantial risk of loss and may not be suitable for all investors. Therefore, carefully consider whether such trading is suitable for you in light of your financial condition. Trading advice is based on information taken from trade and statistical services and other sources Blue Line Futures, LLC believes are reliable. We do not guarantee that such information is accurate or complete and it should not be relied upon as such. Trading advice reflects our good faith judgment at a specific time and is subject to change without notice. There is no guarantee that the advice we give will result in profitable trades. All trading decisions will be made by the account holder. Past performance is not necessarily indicative of future results.
Blue Line Futures is a member of NFA and is subject to NFA’s regulatory oversight and examinations. However, you should be aware that the NFA does not have regulatory oversight authority over underlying or spot virtual currency products or transactions or virtual currency exchanges, custodians or markets. Therefore, carefully consider whether such trading is suitable for you considering your financial condition.
With Cyber-attacks on the rise, attacking firms in the healthcare, financial, energy and other state and global sectors, Blue Line Futures wants you to be safe! Blue Line Futures will never contact you via a third party application. Blue Line Futures employees use only firm authorized email addresses and phone numbers. If you are contacted by any person and want to confirm identity please reach out to us at info@bluelinefutures.com or call us at 312- 278-0500
Like this post? Share it below:
Back to Insights
In case you haven't already, you can sign up for a complimentary 2-week trial of our complete research packet, Blue Line Express.
Free Trial