.png)
The U.S. Economic Cycle | Top Things to Watch this Week
Posted: Nov. 13, 2022, 12:58 p.m.
The U.S. Economic Cycle
"Many were the days and nights in the middle of my campaign when I told myself, What the hell do you think you're doing? Many were the moments when I felt a kind of panicky despair: how can I possibly support myself and make a living while I climb the 8,000ers? Somehow, I figured out how to do it." - Ed Viesturs, No Shortcuts To The Top
Chart Booklet & Podcast
Access all of this week's charts used in today's writing and Macro Corner Episode 24: Chart Booklet
Check out last week's podcast episode on the Macro landscape: Macro Corner Podcast, Episode 23
Email podcast@bluelinefutures.com with any questions as it pertains to today's article or any Macro Corner podcast episode -- we are more than happy to discuss!
This Is Where We Are In The Economic Cycle
In light of Friday's Veterans Day, I wanted to thank all of those who have served in the U.S. military.
I also wanted to remind you, that it is always an option to skip the reading and directly click on the chart booklet. I like to get to the point, cut out what's unimportant, and let the data do the talking. Nevertheless, some context and additional color can often times be valuable; that's why we write each Sunday and follow with a podcast episode each Tuesday. With that, let's get into the macro.
Understanding where we might go in the economic cycle is more often than not conditional on where we're coming from. That is no different today.
After record stimulus from both monetary and fiscal policy makers, the economy is in a renormalization process. Rather than looking for lots of anomalies in today's data, it was 2020 & 2021 where the anomalies were ample. Today, we are simply course correcting unsustainable behaviors of the last 2 years. That doesn't have to mean hyperinflation, depression, or something else that keeps you up at night; it may just mean less excesses, consolidation into the hands of responsible actors, and focus on efficiencies amidst higher cost of capital.
I would argue, this is healthy and desperately needed.
The corporate credit market in Europe and the U.S. has tripled in size since 2008. It would be simplistic to assume that all that money went to good use and has supported economically sound business models; obviously, some of that credit supported zombies. As a result of distress in pockets of corporate credit, the aggregate velocity of loan growth will more likely than not come down and imply less growth. This is a move from inflationary patterns to deflationary dynamics. It is credit that makes the wheels of the economy spin and it is credit that makes them come to a halt.
To put the icing on the cake, J.P. Morgan estimates that 88% of the leveraged loan market is covenant lite (that number is up from 17% in October of 2007.) So, while individuals might have excess savings contributing to inflationary pressures, corporations are more prone to cost of capital dynamics at the moment.
In addition, corporate transaction leverage is out above 2007 highs on average.
Concerns about corporate leverage have led Moody's to believe that the default rate among high-yield borrowers is set to climb to 7.9% in Sep. 2023 (from 2.3% in Sep. 2022).
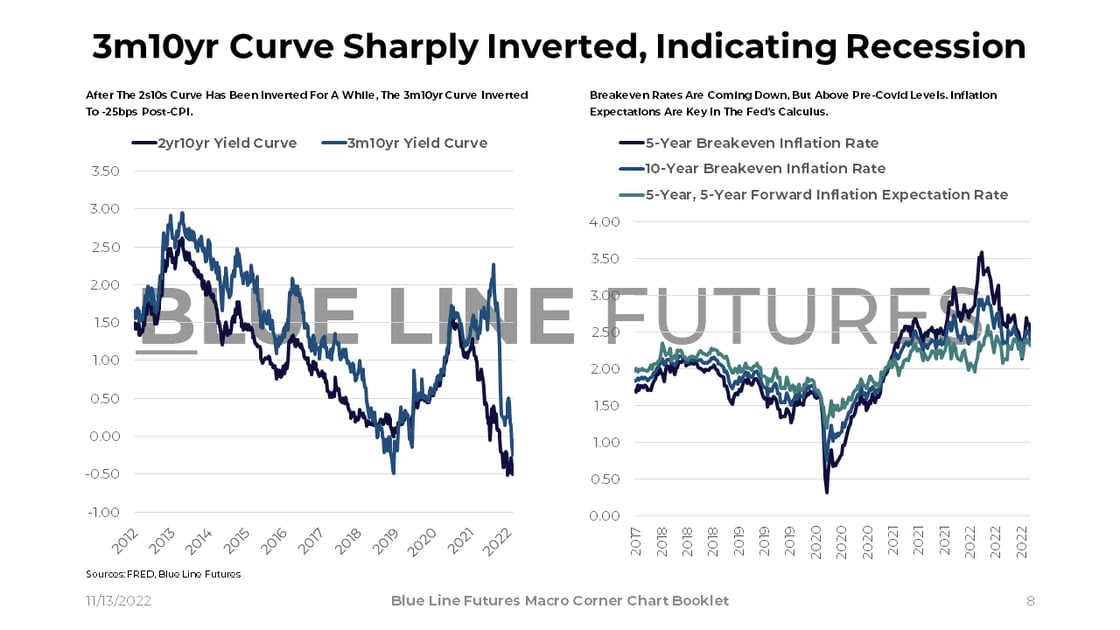
So all in all, we're left with a deleveraging cycle of businesses that will likely be forced to lay off people, therefore add slack to the labor market, and lead to deflationary pressures on the margin. It is a profoundly important question to balance the idea of a slowdown in credit and therefore the economy with the positive effects of reduced inflation and therefore hopes that the Fed will reverse course. The Fed is clearly erring on the side of higher for longer as the risks of overreacting are substantially lower than the risks of not doing enough. This is also why the 3m10yr curve inverted to -25bps this week as CPI is showing first signs of slowing.
Risky assets go up over the long-term if productivity, economic growth, and technological conditions enable these assets to do so. Absent those factors, it is about stock selection. It is partially due to increased government initiatives in areas such as semiconductors that I have doubts about the productivity aspect; government spending is traditionally not known to deliver superb returns.
Data & Commentary
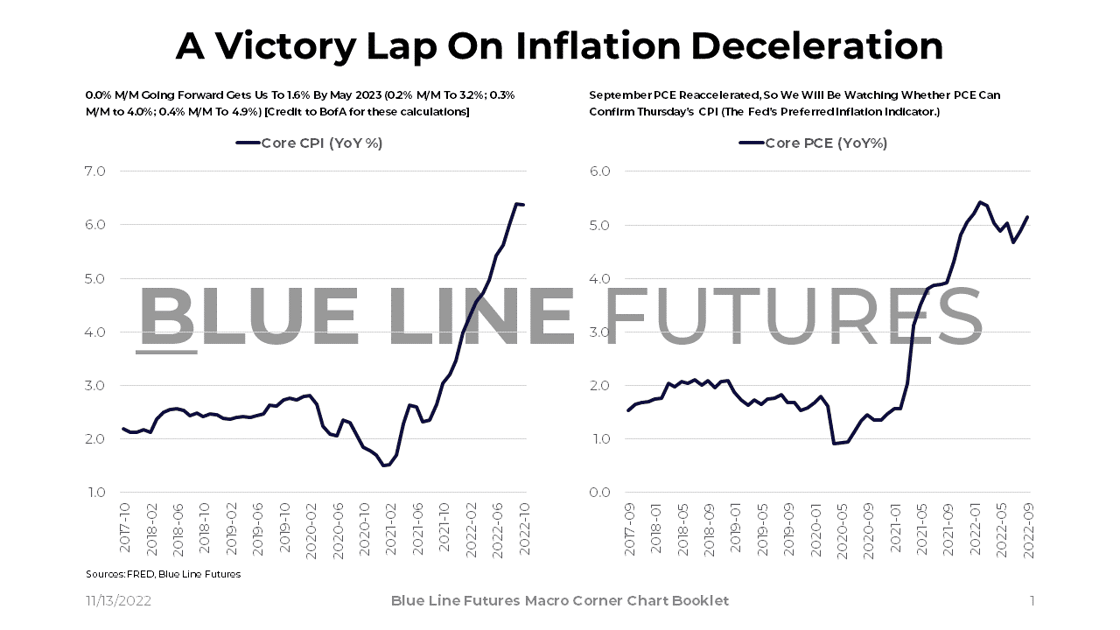
With headline CPI at 0.44% M/M (7.7% Y/Y) and core CPI at 0.27% M/M (6.3% Y/Y), risk assets were quick to respond positively. If Core CPI continued to print 0.3% M/M going forward, we would be near 4.0% by May of 2023 (BofA calculations.) That would be substantial progress, but nevertheless far above the Fed's 2% target.
We will 1.) watch whether PCE confirms what CPI told us on Thursday and 2.) watch the Fed's reaction function with a likely 50bps hike in December.
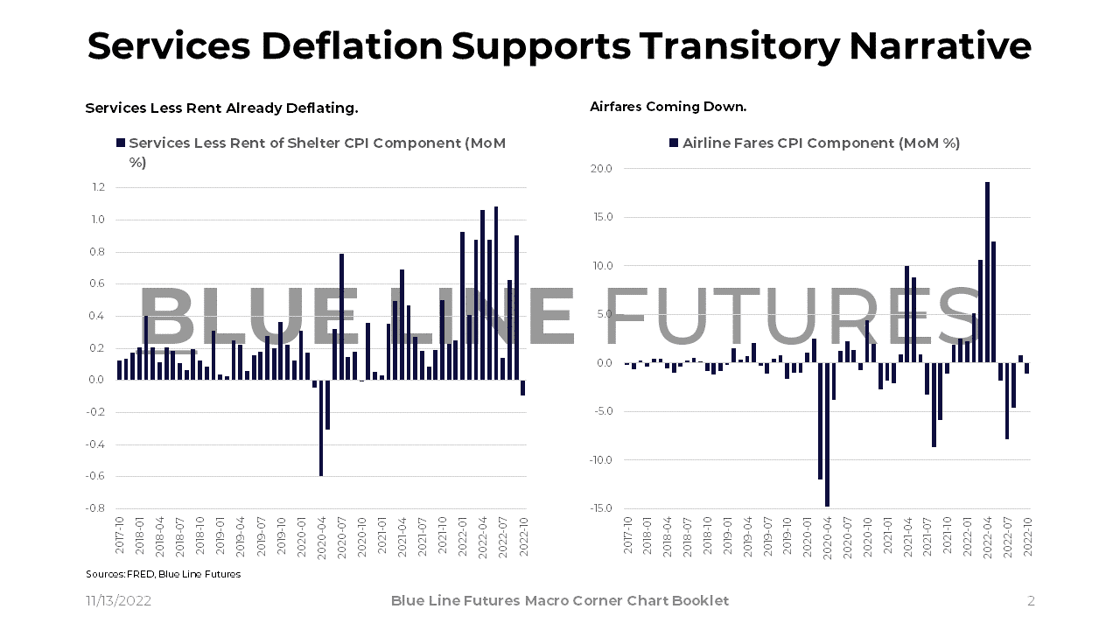
A lack of follow-through on the services side contributed to the deceleration of CPI. This means the shift from goods to services spending may have a lesser impact than anticipated. Deflationary forces in services come at a time where disposable personal income has returned to 2015-2019 trend levels with a lot of spending still coming from excess savings. The stock of excess savings is estimated to be a tad above $1.5 trillion, but sharply off the highs near ~$2.3 trillion.
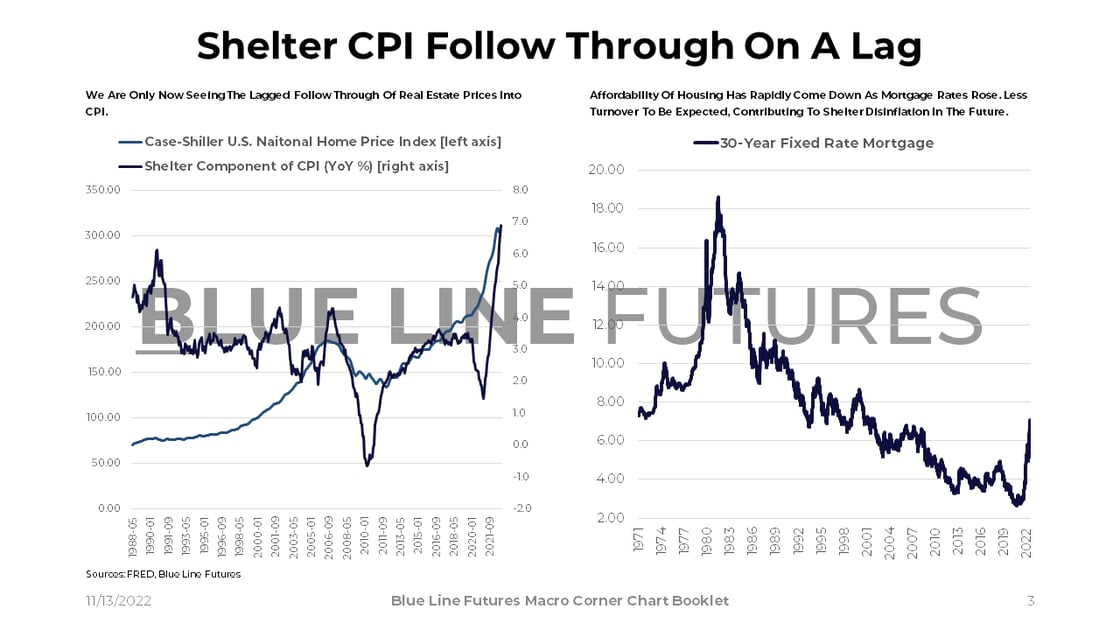
Excess savings are concentrated in the top and third quartile of the income distribution, which means real assets such as housing may stay a little bit more elevated despite a decrease in affordability.
As a result of continued high excess savings, real as well as nominal goods consumption remains far above 2015-2019 trend. In real terms, services spending has yet to catch up to trend, but is out above trend in nominal terms. Strong consumer spending leads to economic growth continuing to stay elevated, suggesting that a coming recession may be shallow in nature.
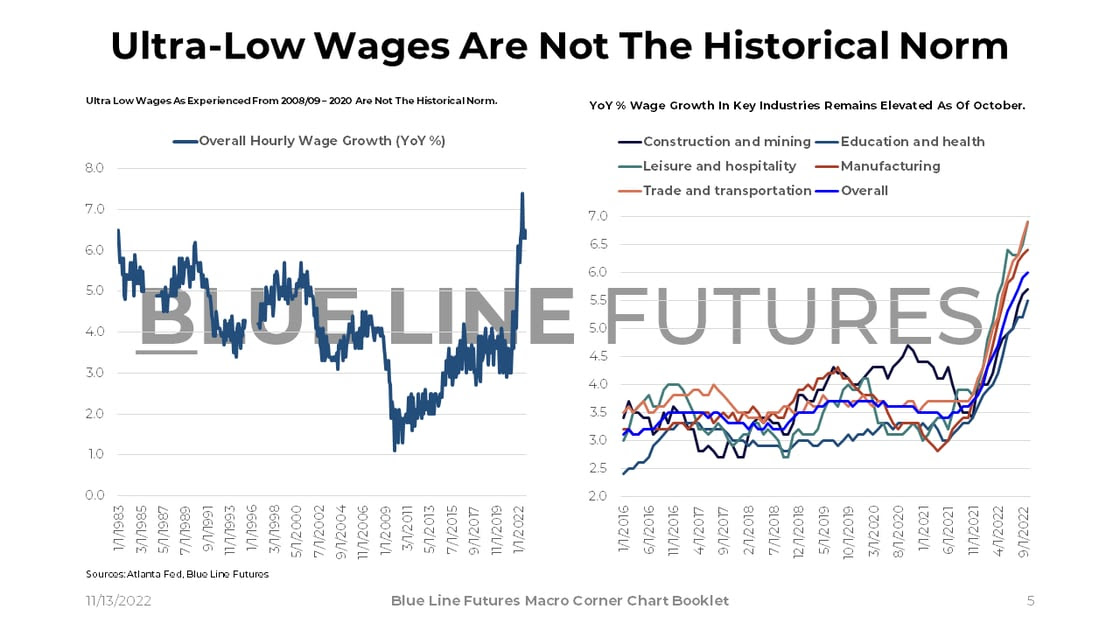
Opposing deflationary forces reflected in CPI, YoY increases in wages have remained very elevated as of October. This is particularly interesting to watch within the context of excess savings getting drained. If savings are lower while prices remain high and inflation above pre-Covid trend, workers will be pressed to demand profits that would have otherwise gone to capital owners.
Despite substantial pessimism from the earnings calls of FedEx and its peers, retail sales data is strong (far exceeding pre-Covid trend.) The world is a mean-reversion mechanism, though, and overinvestment in capacity by companies is normalizing.
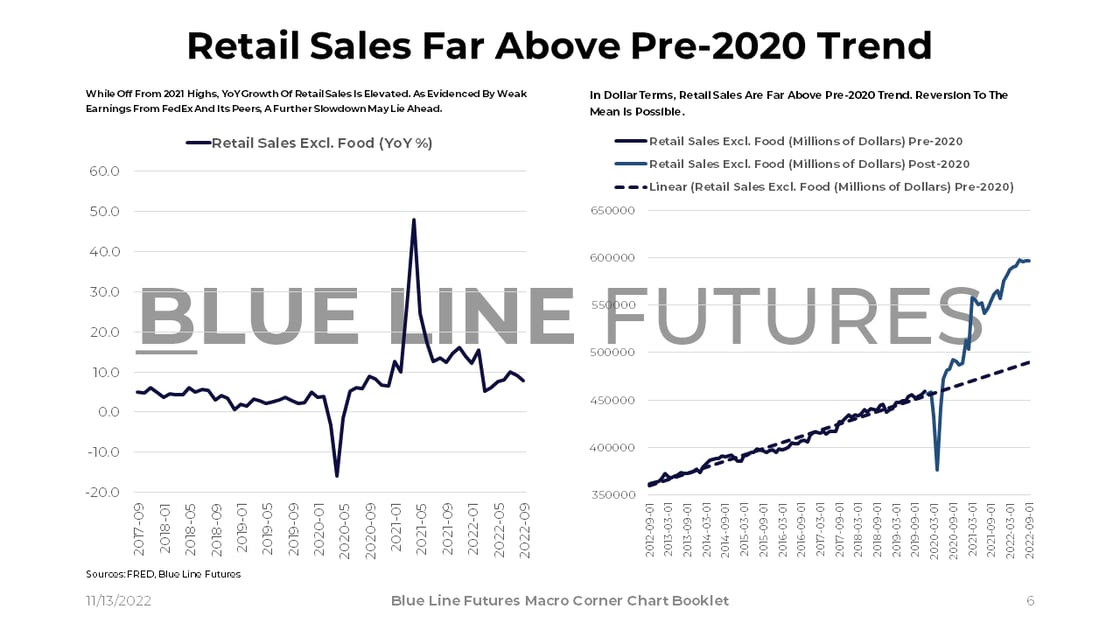
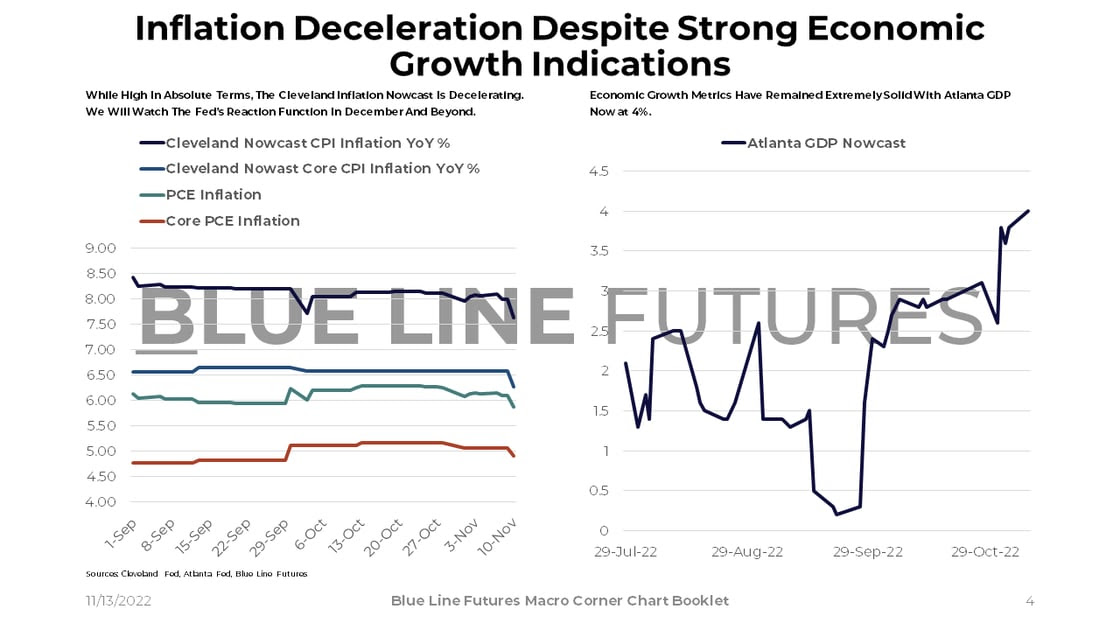
Economic activity is also strong as measured by industrial production. It is true that petro-related industries are a contributor, but it is undeniable that above pre-Covid production is evidence of a better-than-feared economy. If we go into a recession, which market-based indicators are pointing to, nominal growth can remain high.

While real economic indicators are signaling a strong economy, the Fed's preferred recession indicator (3m10yr curve) is pointing to dire times ahead. In the fight against inflation, forward expectations of prices will be key to watch. Pre-Jackson Hole, the rally in breakeven rates contributed to a hawkish speech by Jay Powell. Post-CPI, breakeven rates as well as treasury yields have corrected lower. It is forward inflation expectations that drive the Fed's reaction function (how high for how long.)
The world is in a highly indebted state and cost of capital concerns are increasingly relevant. While U.S. high-yield is a point of concern, China Debt/GDP is expected to have increased from 274% in 2021 to 289% in 2022 (via Michael Pettis on Twitter.) Fiscal dominance means low productivity and low return-on-capital. If government involvement increases globally, more of that can be expected to occur outside China. The U.S. may well find itself in a technical recession next year with long-term returns on capital increasingly in question. Inflation numbers will impact things on the margin and lead to substantial market movements as we saw on Thursday. When we slow the game down, however, the Fed is adjusting to a new set of economic circumstances rather than the other way around. The Fed's message: Pain today is more desirable than pain tomorrow.
Until next time, good luck & good trading.
Be sure to check out prior writing of Top Things to Watch this Week:
- Regime Shift On Wall Street - November 6, 2022
- Climbing The Macro Mountain - October 30, 2022
- The Dollar Wrecking Ball & Sovereign Bond Yields - October 23, 2022
Our Blue Line Futures Trade Desk is here to talk about positioning, idea and strategy generation, assisted accounts, and more! Don't miss our daily Research with actionable ideas (Click Here To Sign Up)
Schedule a Consultation or Open your free Futures Account today by clicking on the icon above or here. Email info@BlueLineFutures.com or call 312-278-0500 with any questions!
Economic Calendar
U.S.

Data Release Times (C.T.)
China
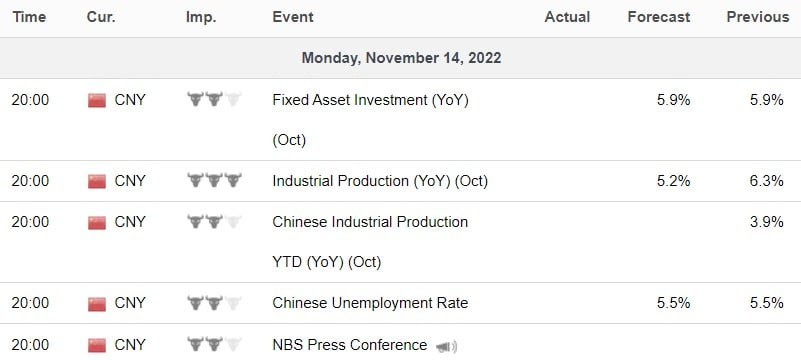
Data Release Times (C.T.)
Eurozone
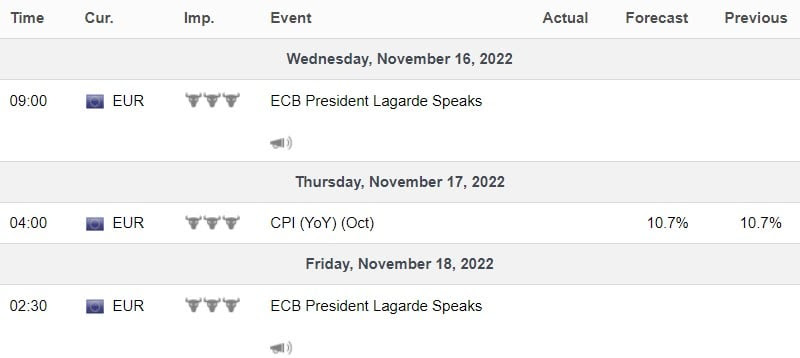
Data Release Times (C.T.)
More Of The Upcoming Economic Data Points Can Be Found Here.
Food for Thought
Earnings
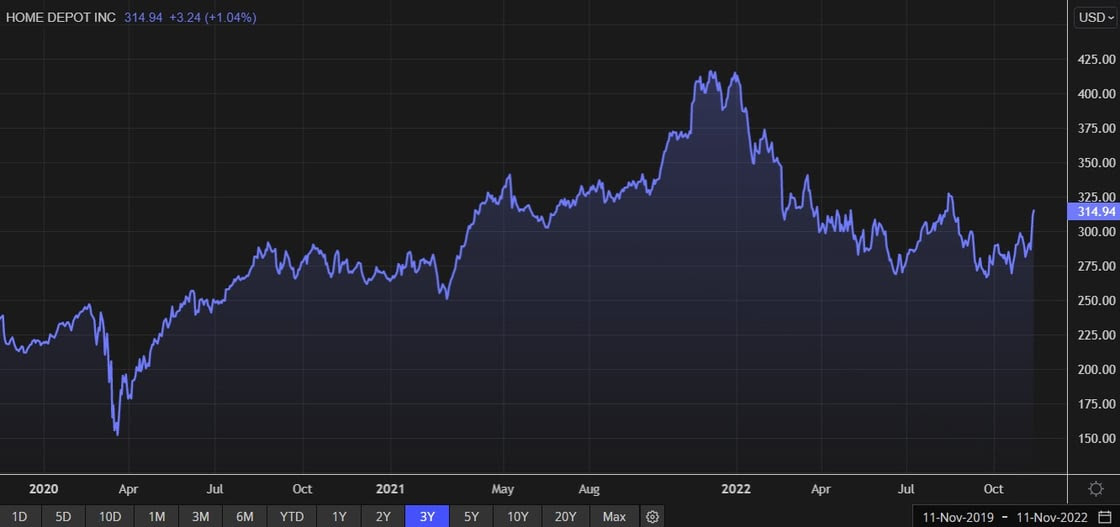
Home Depot (HD) reporting before the open on Tuesday:
- Consensus: EPS est. $4.11; Revenue est. $37.90bn
Commentary on the following be monitored:
- State of the U.S. housing market
- Consumer spending on home improvements
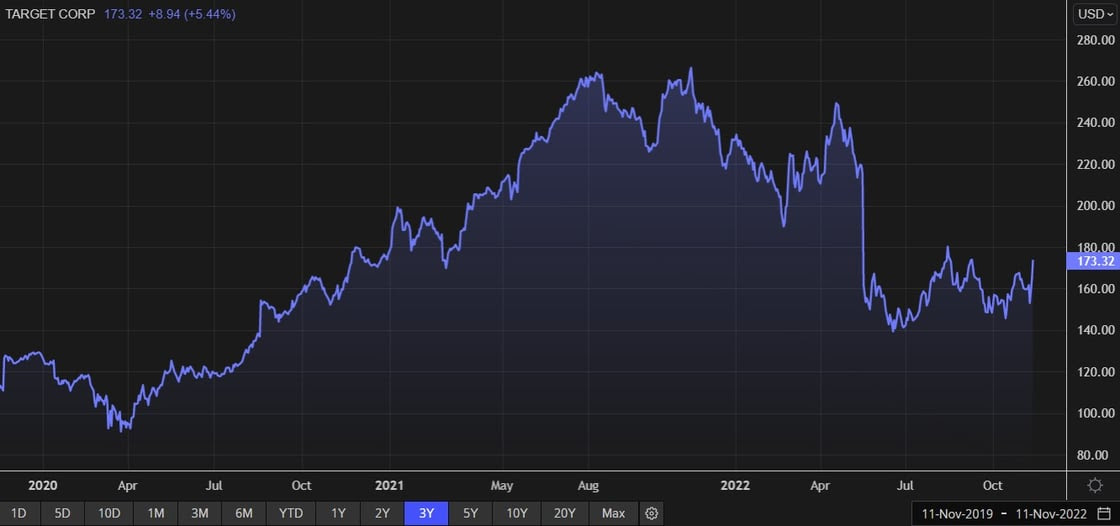
Target (TGT) reporting before the open on Wednesday:
- Consensus: EPS est. $2.14; Revenue est. $26.37bn
Commentary on the following be monitored:
- Consumer spending after sharp revisions to the outlook during prior earnings
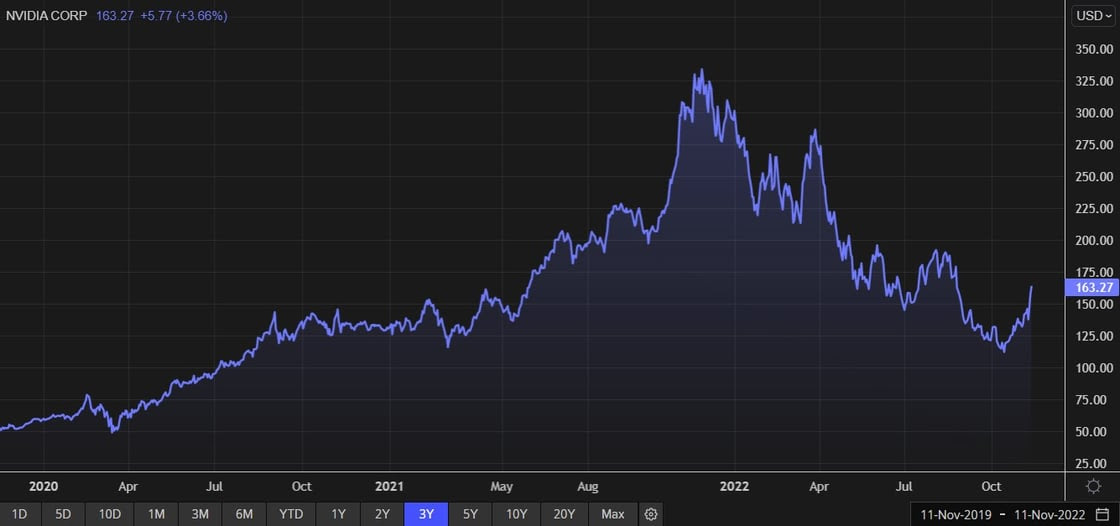
Nvidia (NVDA) reporting after the close on Wednesday:
- Consensus: EPS est. $0.68; Revenue est. $5.80bn
Commentary on the following be monitored:
- State of the semiconductor industry
- The chip inventory cycle
Blue Line Capital
If you have questions about any of the earnings reports, our wealth management arm, Blue Line Capital, is here to discuss! Email info@bluelinecapllc.com or call 312-837-3944 with any questions! Visit Blue Line Capital's Website
Sign up for a 14-day, no-obligation free trial of our proprietary research with actionable ideas!
Free Trial
Start Trading with Blue Line Futures
Subscribe to our YouTube Channel
Email info@Bluelinefutures.com or call 312-278-0500 with any questions -- our trade desk is here to help with anything on the board!
Futures trading involves substantial risk of loss and may not be suitable for all investors. Therefore, carefully consider whether such trading is suitable for you in light of your financial condition. Trading advice is based on information taken from trade and statistical services and other sources Blue Line Futures, LLC believes are reliable. We do not guarantee that such information is accurate or complete and it should not be relied upon as such. Trading advice reflects our good faith judgment at a specific time and is subject to change without notice. There is no guarantee that the advice we give will result in profitable trades. All trading decisions will be made by the account holder. Past performance is not necessarily indicative of future results.
Blue Line Futures is a member of NFA and is subject to NFA’s regulatory oversight and examinations. However, you should be aware that the NFA does not have regulatory oversight authority over underlying or spot virtual currency products or transactions or virtual currency exchanges, custodians or markets. Therefore, carefully consider whether such trading is suitable for you considering your financial condition.
With Cyber-attacks on the rise, attacking firms in the healthcare, financial, energy and other state and global sectors, Blue Line Futures wants you to be safe! Blue Line Futures will never contact you via a third party application. Blue Line Futures employees use only firm authorized email addresses and phone numbers. If you are contacted by any person and want to confirm identity please reach out to us at info@bluelinefutures.com or call us at 312- 278-0500
Like this post? Share it below:
Back to Insights
In case you haven't already, you can sign up for a complimentary 2-week trial of our complete research packet, Blue Line Express.
Free Trial