How to trade a U.S. default
Posted: May 19, 2023, 12:59 p.m.
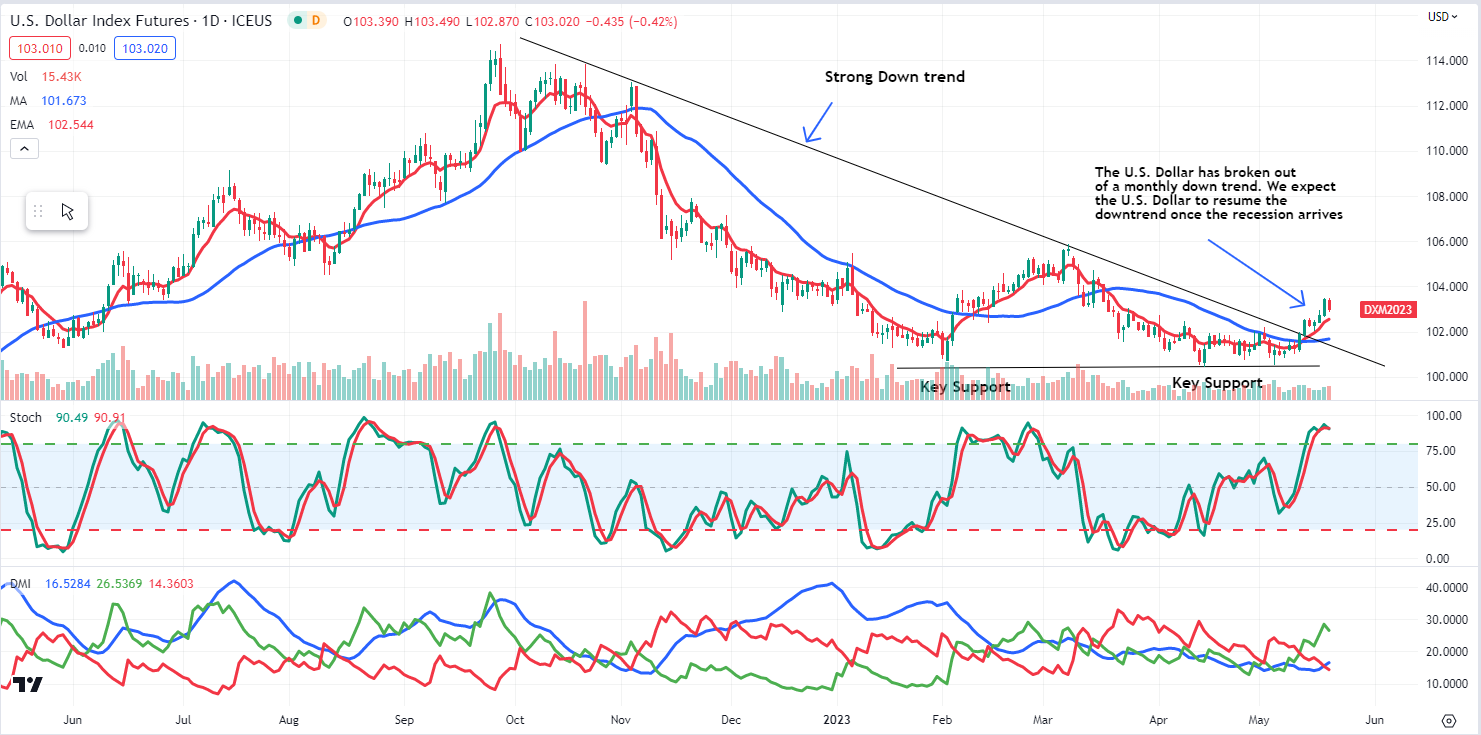
The bears continued their assault on Precious Metals this week, with Gold extending its decline since May 10th by $90 and Silver down $2.50/oz. The shift from bullish to bearish sentiment happened as investors pushed out their expectations for a Fed pivot, along with the first scheduled interest rate cut. The combination of weaker economic data abroad (ex., Chinese Industrial Production actual 5.6% vs. 10.9% expected) weighs in on foreign currencies giving a tailwind boost to the U.S. Dollar. Most fluctuations in commodities (negative or positive) occur from changes in the U.S. Dollar's value because most are imported or exported abroad. For those unaware, the U.S. Dollar index measures the value of U.S. Dollar's relative to a basket of foreign currencies and was established by the U.S. Federal Reserve in 1973 after the dissolution of the Bretton Woods Agreement.
Daily U.S. Dollar Chart
Daily Gold Chart
The technical backdrop for Gold is damaging as the "traders" that chased the market in early May near the all-time highs frantically liquidated their positions on Tuesday when Gold breached $2000/oz. Those same traders rotated into technology stocks pushing the Nasdaq to the highest level since last August. Monitoring these flows and cross-currents is vital because once U.S. economic data begins to slip, those same traders will jump back into Gold, pushing it to new all-time highs. The consumer supports much of the U.S. economic activity through the use of credit card debt, which has also cycled to new all-time highs. It is a matter of time before the recession hits and yields plunge. In the short-term, the current U.S. debt ceiling talks are suspended as of this writing (Friday afternoon); therefore, while I describe the chart pattern initially as "damaging," it offers short-term and long-term opportunity if a default was to happen.
To further help you develop a trading plan, I went back through 20 years of my trading strategies to create a Free New "5-Step Technical Analysis Guide to Gold that can easily apply to Silver." The guide will provide you with all the Technical analysis steps to create an actionable plan used as a foundation for entering and exiting the market. You can request yours here: 5-Step Technical Analysis Guide to Gold.
Daily Silver Chart
The chart pattern in Silver has been strikingly similar to that of Gold since the beginning of May. We are approaching that opportunity for those patient enough to wait for a correction to re-enter the market, while our previous call to use the eight-day exponential moving average (EMA) for risk management proved timely. The near-term bearish forces drove prices nearly down to the 50% retracement giving us another excellent opportunity to add to core positions using the December 1000 oz Silver contract. Fundamentally, there is tightness in the physical markets, and the mining supply is beginning to decline. We expect that over the next year, demand from solar, electric vehicles, and other technological advances will create the next "Silver-Squeeze," extending prices back to contract highs.
Having the flexibility to enter and exit the market quickly makes it essential for Precious Metals investors to have a futures trading account alongside their core Physical Precious Metals holdings. If you are interested in speculating on the rise and fall of the price of Precious Metals on a shorter-term basis, such as two weeks or two months, or If you have never traded futures or commodities, I just completed a new educational guide that answers all your questions on transferring your current investing skills into trading "real assets," such as the 1000 oz Silver futures contract. You can request yours here: Trade Metals, Transition your Experience Book.
Sign up for a 14-day, no-obligation free trial of our proprietary research with actionable ideas!
Free Trial
Start Trading with Blue Line Futures
Subscribe to our YouTube Channel
Email info@Bluelinefutures.com or call 312-278-0500 with any questions -- our trade desk is here to help with anything on the board!
Futures trading involves substantial risk of loss and may not be suitable for all investors. Therefore, carefully consider whether such trading is suitable for you in light of your financial condition. Trading advice is based on information taken from trade and statistical services and other sources Blue Line Futures, LLC believes are reliable. We do not guarantee that such information is accurate or complete and it should not be relied upon as such. Trading advice reflects our good faith judgment at a specific time and is subject to change without notice. There is no guarantee that the advice we give will result in profitable trades. All trading decisions will be made by the account holder. Past performance is not necessarily indicative of future results.
Blue Line Futures is a member of NFA and is subject to NFA’s regulatory oversight and examinations. However, you should be aware that the NFA does not have regulatory oversight authority over underlying or spot virtual currency products or transactions or virtual currency exchanges, custodians or markets. Therefore, carefully consider whether such trading is suitable for you considering your financial condition.
With Cyber-attacks on the rise, attacking firms in the healthcare, financial, energy and other state and global sectors, Blue Line Futures wants you to be safe! Blue Line Futures will never contact you via a third party application. Blue Line Futures employees use only firm authorized email addresses and phone numbers. If you are contacted by any person and want to confirm identity please reach out to us at info@bluelinefutures.com or call us at 312- 278-0500
Like this post? Share it below:
Back to Insights
In case you haven't already, you can sign up for a complimentary 2-week trial of our complete research packet, Blue Line Express.
Free Trial