Are The "Long & Variable Lags" Even Longer, Or Is The Economy Resetting To 2019?
Posted: April 9, 2023, 7:44 p.m.
Nonfarm Payrolls Review Ahead Of CPI & PPI
"Age is not the enemy. Stagnation is the enemy. Complacency is the enemy. Stasis is the enemy." - Twyla Tharp
Chart Booklet & More
Access this week's chart booklet covering the latest employment data and its implications for the Federal Reserve. We also cover in-depth corporate trends of Ford, General Motors, and Tesla. We will provide an updated chart book with more data on corporate trends when we release Triple Play Episode 14!
Triple Play Podcast
Don't miss episode 13 of our Triple Play Podcast! Bill Baruch and Jannis Meindl discuss the latest macro trends and share three actionable stock ideas.

Are The "Long & Variable Lags" Even Longer, Or Is The Economy Resetting To 2019?
200k+ Jobs Does Not Smell Like Recession
After pausing this write-up for a week, we're back with data-driven insights that hope to aid your understanding of the macro picture and its implications for asset class performance. Strong views hold loosely is the name of the game, given that we're using inference as more data becomes available, which, by definition, means we can and need to be flexible in our thinking. With that, let's get into Friday's Nonfarm Payrolls data ahead of CPI on Wednesday and PPI on Thursday.
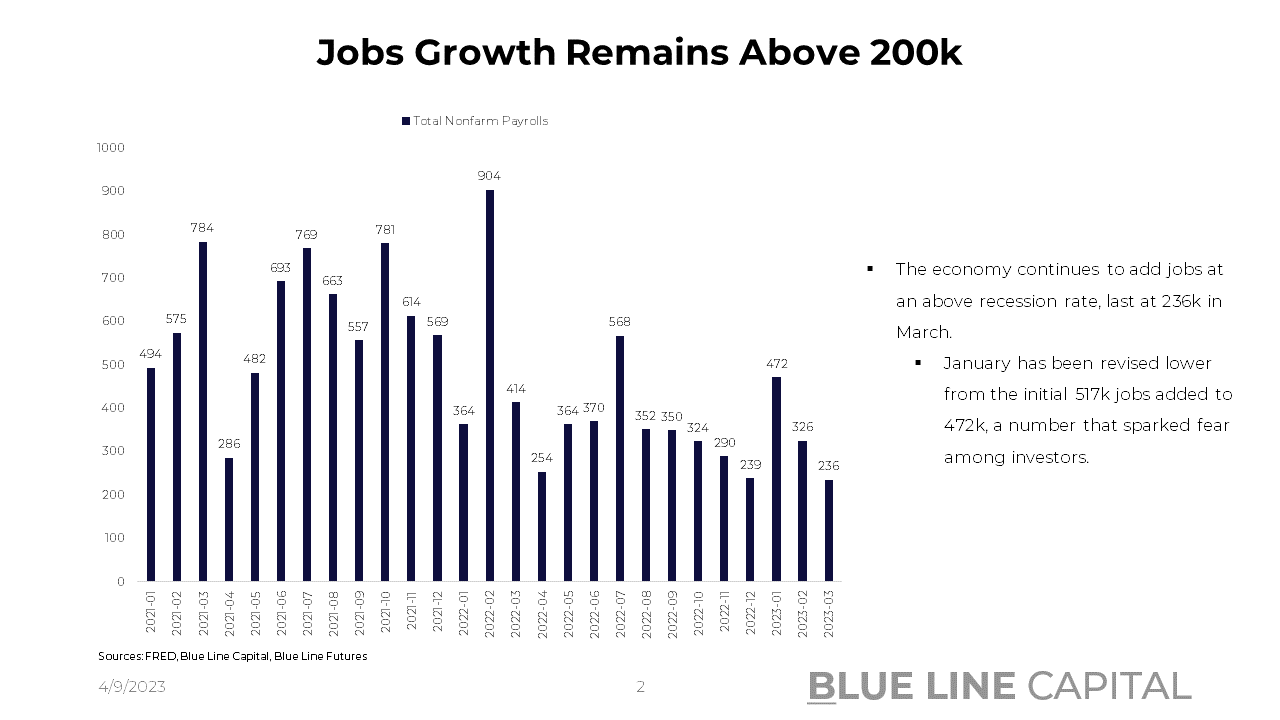
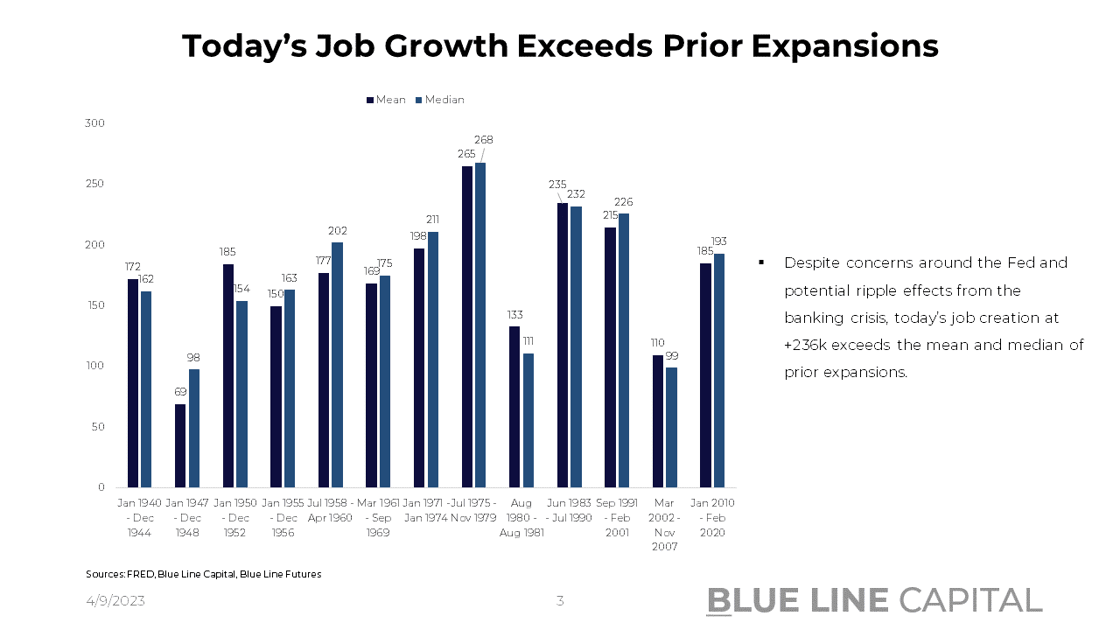
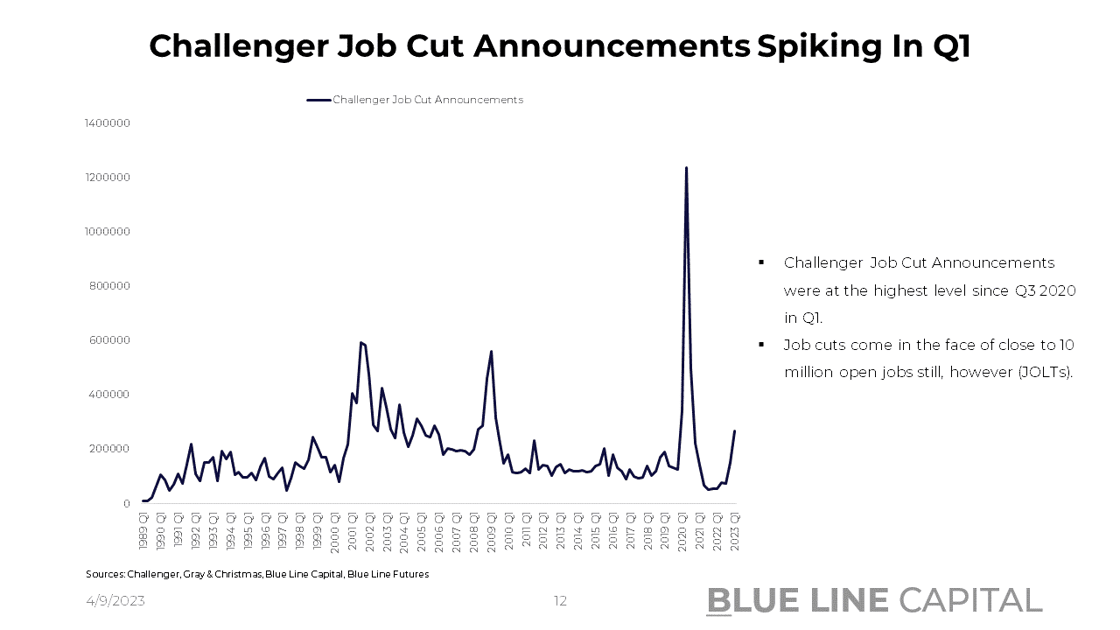
On Friday, the Bureau of Labor Statistics published +236k job additions for March after 326k in February and 472k in January. The data viewed in isolation does not only mean we might skip the most televised recession in history; we are also expanding jobs in the economy more than during prior expansions. On slide 3 of today's chart pack, you can see that the 2010 - 2022 expansion saw an average of 185k job additions per month at a median of 193k. During the 2002 - 2007 expansion, the economy added 110k jobs on average, with a median of 99k. The expansion before then, Sep. 1991 - Feb. 2001, saw 215k additions on average with a median of 226. Thus, Friday's number is not only not indicative of an economy that's about to fall apart but shows a job market that's much more healthy than Challenger Job Cuts at the highest level since Q3 2020 suggest.
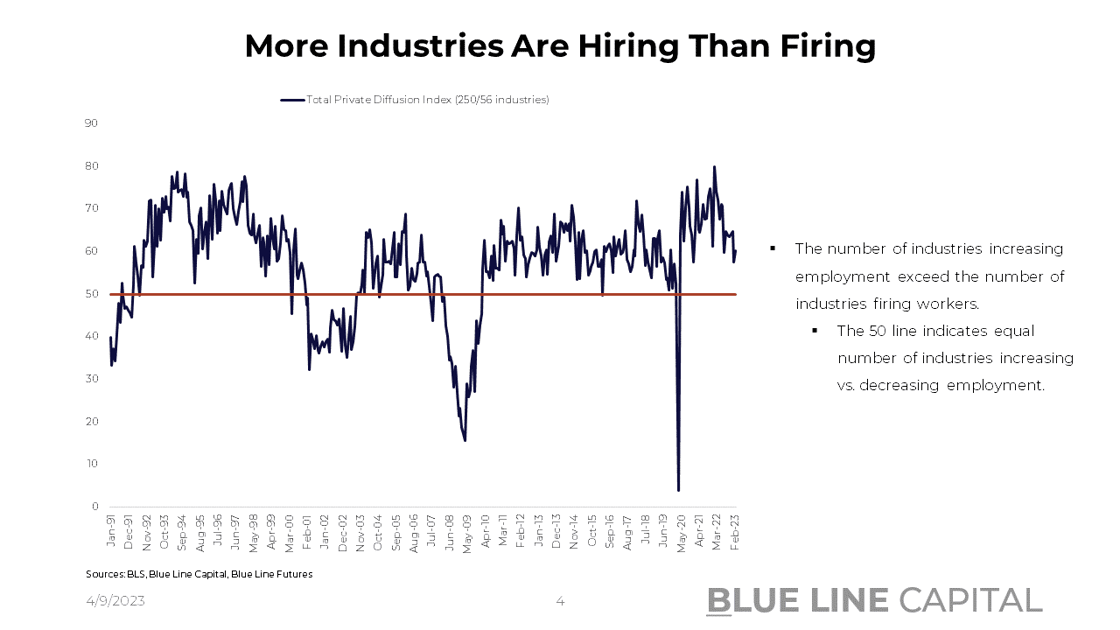
The economic expansion picture solidifies when we look at the Nonfarm Payrolls Industry Diffusion Index at 60.2 in March, up from 57.4 in February, indicating that 10% more industries are hiring than firing on the net. Although we're off February 2022 highs at 79.9, constituting a record high of the series, March data aligns with prior expansions.
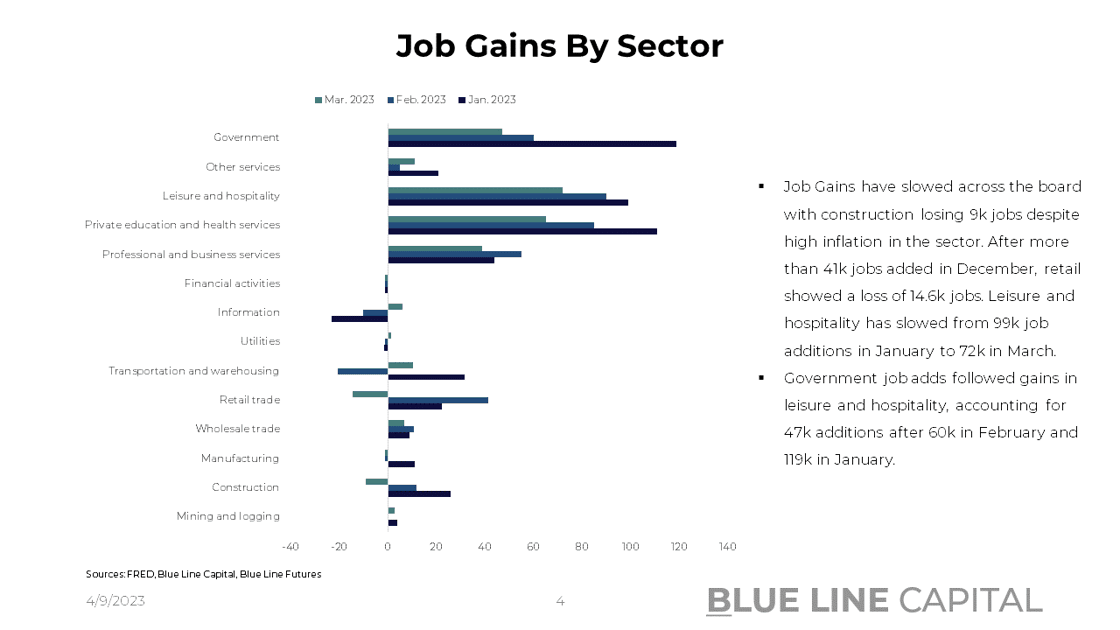
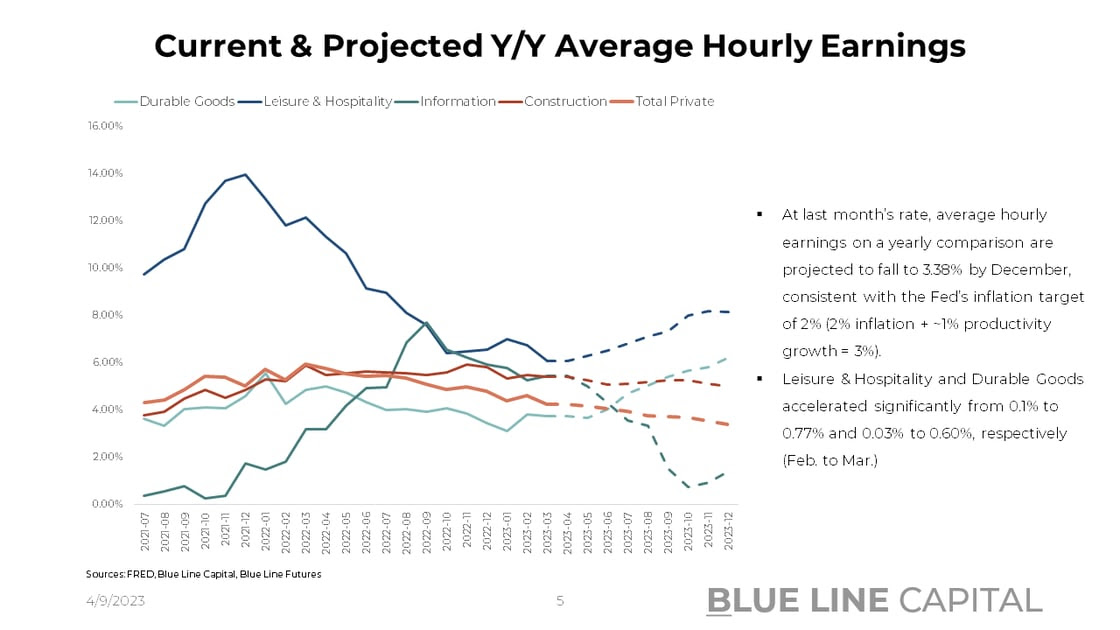
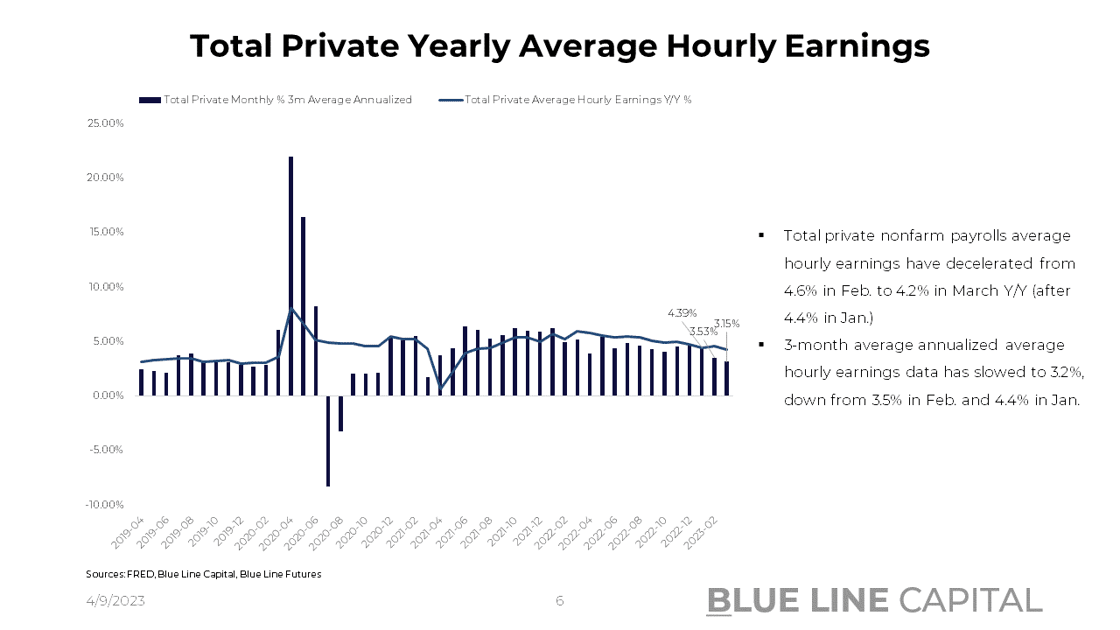
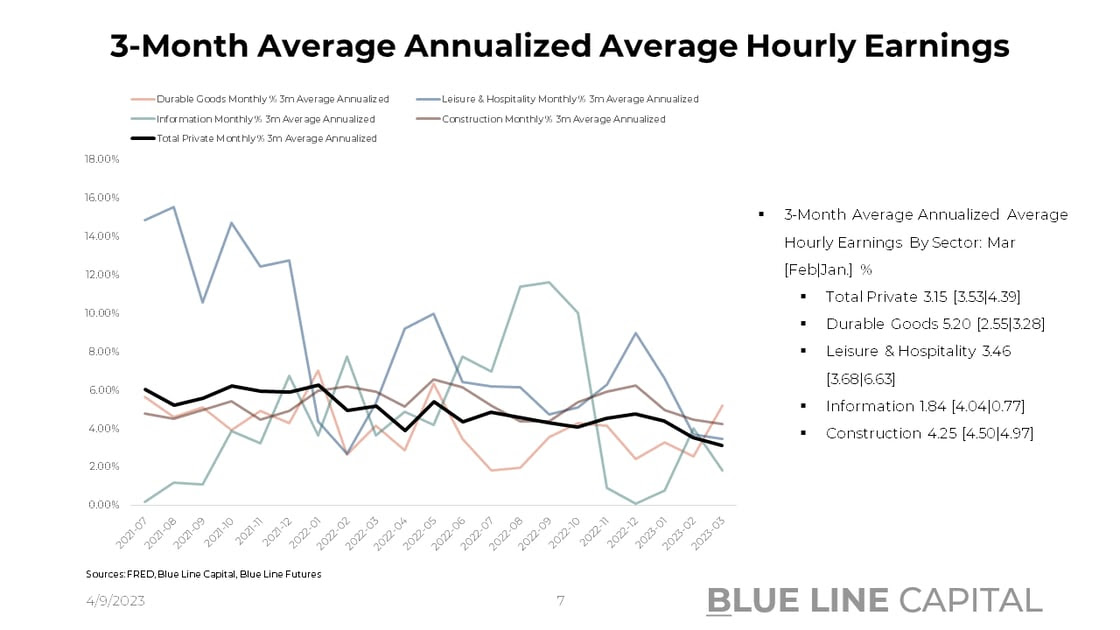
Turning to wage data, average hourly earnings for March declined to 4.24% Y/Y in March, down from 4.62% in February and 4.38% in January; accounting for year-over-year base distortions, 3-month average annualized average hourly earnings are in-line with the Fed's 2% inflation target at 3.15% last month after 3.53% in February. Accounting for 2% inflation and ~1% productivity gains, wage-price spiral fears may not be as front & center as they were a few months ago. Less encouraging on the wage front, leisure & hospitality accelerated from 0.10% in February to 0.77% in March, and durable goods wages spiked from 0.03% to 0.60%. While durable goods may be distorted, it is a question of whether a deceleration in job gains on the leisure & hospitality side will ultimately translate into another slowdown in wage gains; more importantly, though, it is a seasonal time of year where one would expect a tick-up in leisure & hospitality with summer holidays around the corner -- businesses don't want to be short staff and make sure their team is well paid.
Looking beyond headline job additions and wage trends, temporary help services, a leading indicator for the job market, have contracted by 100k jobs since February 2020. During past recessions at the tail end of 2019, 2007, and the late 1990s/early 2000s, temporary help services declined while aggregate employment remained high before contracting.
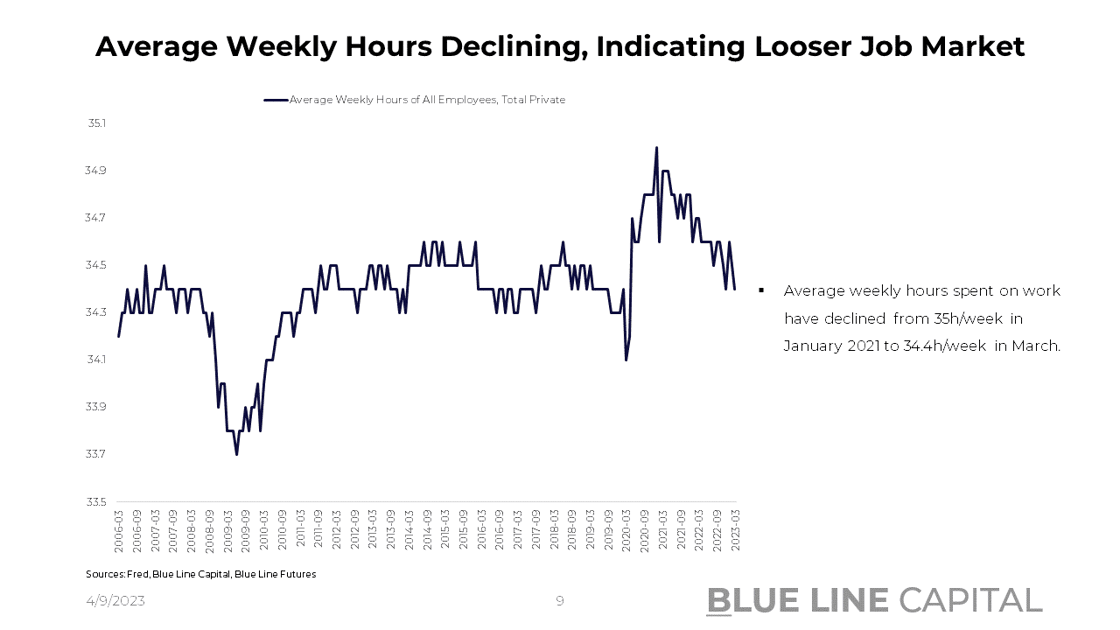
We get another indication that the job market is becoming looser when we turn to average weekly hours worked, which have declined from a high of 35h/week in January 2021 to 34.4h/week as of March. Nevertheless, hours worked are roughly in line with pre-Covid levels.
Significant for labor supply in the economy, labor force participation continues to trend higher at 62.6%, up from a trough of 61.3% in Jan. 2021. People returning to the workforce, which leads to a lower wage-price spiral equilibrium, at least in the near term, is also shown in the employment-to-population ratio. From a trough level of 57.4% in October of 2020, we have now climbed back to 60.4% compared to 60.2% a month prior; while this compares unfavorably against 61.1% in Feb. 2020, the incremental worker is returning, not leaving. Among workers aged 25 - 54, 83.1% are working, exceeding the pre-Covid high of 83% after troughing at 79.9% in April 2020.
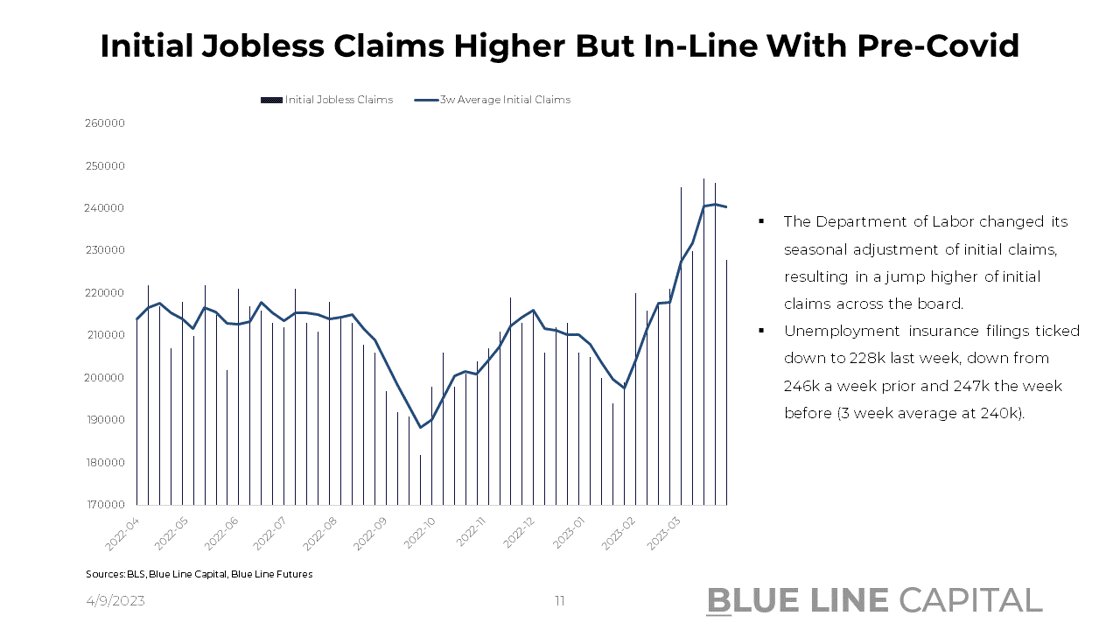
Favorable wage-price trends also pop up when we turn to the Department of Labor's revisions to initial jobless claims, which show that unemployment claims have been rising ever since February, unlike what was suggested before. That also means the supply-demand imbalance in the labor market is not as stark as previously suggested; the question revolves around degrees and magnitudes; if we were to trend lower as indicated by the NFIB Small Business Hiring Plans that are not rosy right now, we would have to return to a recession playbook. Absent such a course, however, this could be a return to a low-growth, low-inflation regime that's very favorable for some assets.
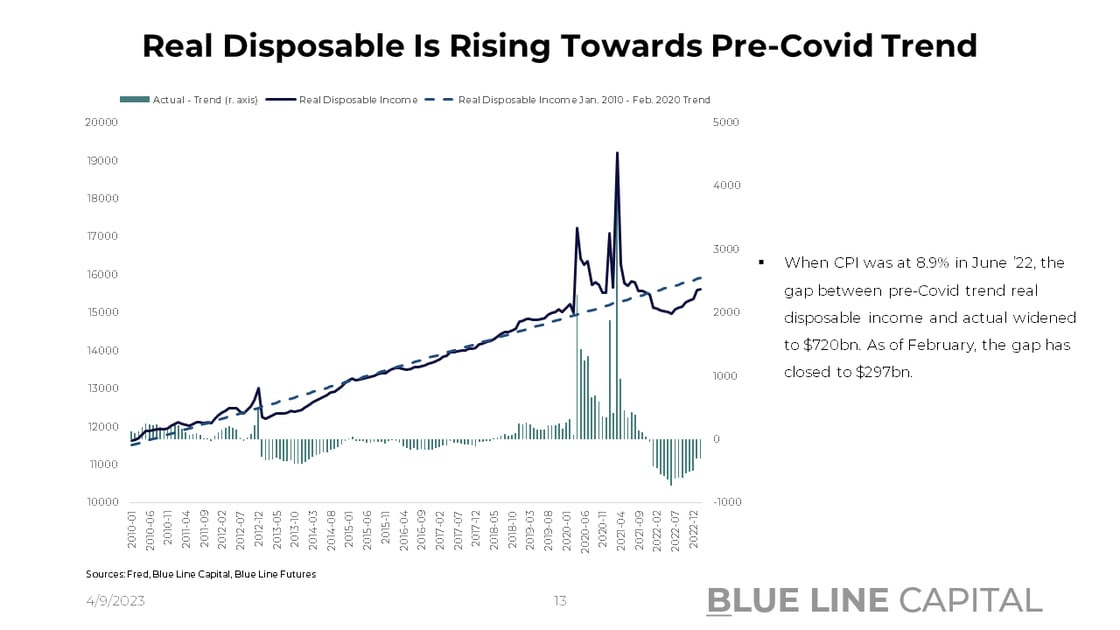
Lastly, I would also like to highlight the consumer and what wage gains mean concerning inflation. Ultimately, what burdens the consumer amidst inflation is wage gains that lag the pace of inflation, which in turn leads to less purchasing power; however, if wage gains exceed inflation, we're talking about positive real wage gains that can propel spending for some time. Real disposable income is now heading back to Jan. 2010 - Feb. 2020 trend, closing the gap from $720bn in June 2022 to $297bn as of February.
At the outset of today's brief reflection on wage and job trends, I want to acknowledge that this is an ever-evolving market landscape. Today's tailwind becomes tomorrow's headwind and vice versa. Despite data mainly pointing in the right direction in a purely economic sense, I ask myself: have I become too complacent? Is commercial real estate the next shoe to drop? What are the implications of tightening lending standards, and how long are the "long and variable" lags the Fed keeps talking about? Given the probabilistic nature of markets, it is prudent for all of us to ask that question more often than not. The beauty about all of this: we get instant feedback like in no other practice or profession.
Please check out all the macro data in this week's chart pack.
Chart-Pack Macro Slides


Stay tuned for Episode 14 of Triple Play!
Until next time, good luck & good trading.
Be sure to check out prior writing of Top Things to Watch this Week:
- Fed, Credit Markets & Sector Dynamics - Mar. 26, 2023
- The Inflation Review With Consumer Prices, Producer Price And Other Inflation Trends - Mar. 19, 2023
- Gaining Clarity In The Fog Of War (Silicon Valley Bank's Duration Wipeout) - Mar. 13, 2023
Our Blue Line Futures Trade Desk is here to talk about positioning, idea and strategy generation, assisted accounts, and more! Don't miss our daily Research with actionable ideas (Click Here To Sign Up)
Schedule a Consultation or Open your free Futures Account today by clicking on the icon above or here. Email info@BlueLineFutures.com or call 312-278-0500 with any questions!
Economic Calendar
U.S.
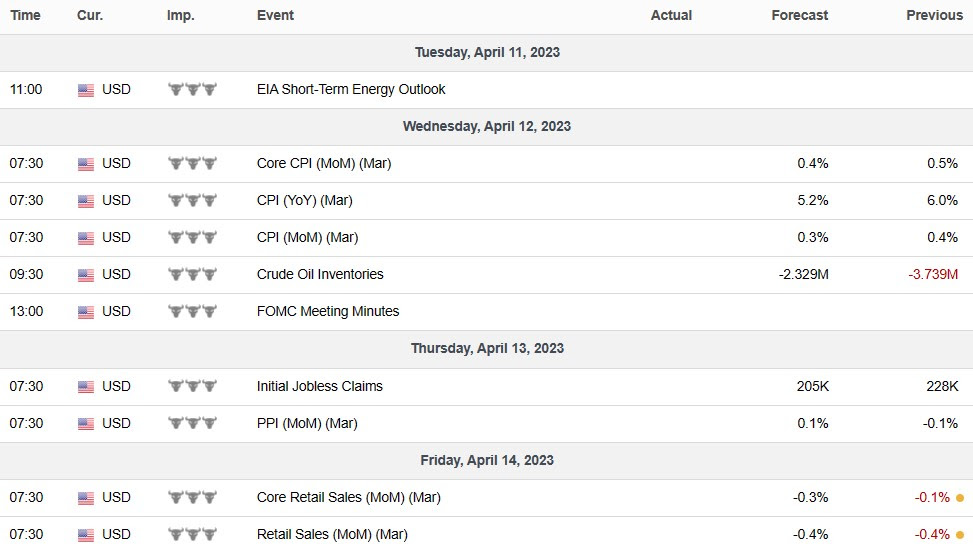
Data Release Times (C.T.)
China
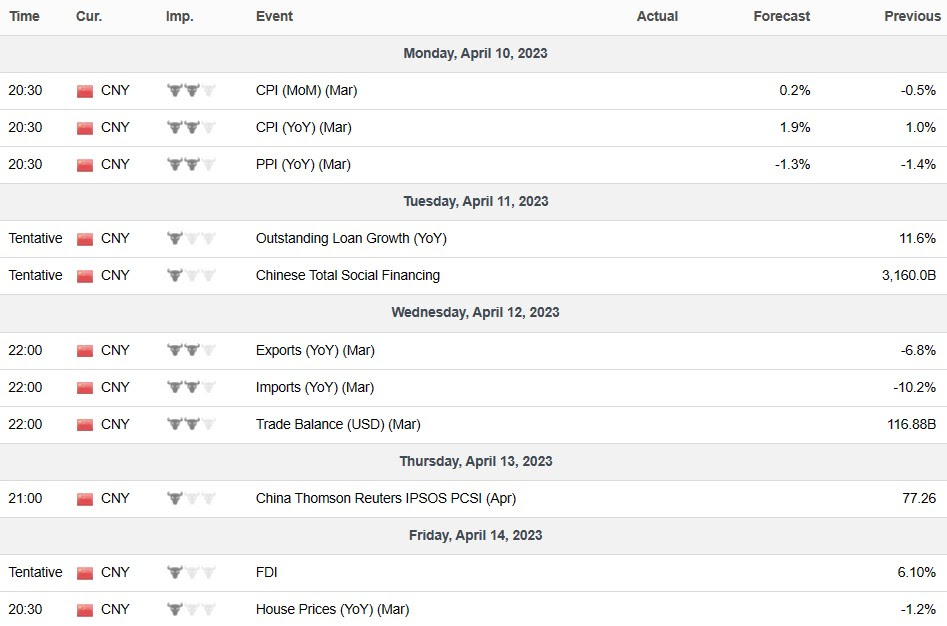
Data Release Times (C.T.)
Eurozone
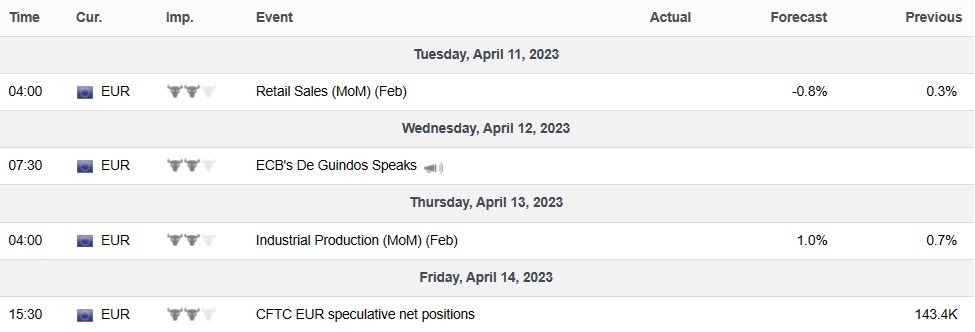
Data Release Times (C.T.)
More Of The Upcoming Economic Data Points Can Be Found Here.
Blue Line Capital
If you have questions about any of the earnings reports, our wealth management arm, Blue Line Capital, is here to discuss! Email info@bluelinecapllc.com or call 312-837-3944 with any questions! Visit Blue Line Capital's Website
Sign up for a 14-day, no-obligation free trial of our proprietary research with actionable ideas!
Free Trial
Start Trading with Blue Line Futures
Subscribe to our YouTube Channel
Email info@Bluelinefutures.com or call 312-278-0500 with any questions -- our trade desk is here to help with anything on the board!
Futures trading involves substantial risk of loss and may not be suitable for all investors. Therefore, carefully consider whether such trading is suitable for you in light of your financial condition. Trading advice is based on information taken from trade and statistical services and other sources Blue Line Futures, LLC believes are reliable. We do not guarantee that such information is accurate or complete and it should not be relied upon as such. Trading advice reflects our good faith judgment at a specific time and is subject to change without notice. There is no guarantee that the advice we give will result in profitable trades. All trading decisions will be made by the account holder. Past performance is not necessarily indicative of future results.
Blue Line Futures is a member of NFA and is subject to NFA’s regulatory oversight and examinations. However, you should be aware that the NFA does not have regulatory oversight authority over underlying or spot virtual currency products or transactions or virtual currency exchanges, custodians or markets. Therefore, carefully consider whether such trading is suitable for you considering your financial condition.
With Cyber-attacks on the rise, attacking firms in the healthcare, financial, energy and other state and global sectors, Blue Line Futures wants you to be safe! Blue Line Futures will never contact you via a third party application. Blue Line Futures employees use only firm authorized email addresses and phone numbers. If you are contacted by any person and want to confirm identity please reach out to us at info@bluelinefutures.com or call us at 312- 278-0500
Like this post? Share it below:
Back to Insights
In case you haven't already, you can sign up for a complimentary 2-week trial of our complete research packet, Blue Line Express.
Free Trial