.png)
Fed, Credit Markets & Sector Dynamics | Top Things to Watch
Posted: March 26, 2023, 1:06 p.m.
Fed, Credit Markets & Sector Dynamics
"Victorious warriors win first and then go to war, while defeated warriors go to war first and then seek to win." - Sun Tzu
Chart Booklet & More
Access this week's chart booklet covering the Fed, lending standards, real estate, and more. We also cover in-depth corporate trends of Micron Technology, American Express, and Lennar. We will provide an updated chart book with more data on corporate trends when we release Triple Play Episode 13!
Triple Play Podcast
Don't miss episode 12 of our Triple Play Podcast! Bill Baruch and Jannis Meindl discuss the latest macro trends and share three actionable stock ideas.

The Fed & Credit
Federal Reserve, Lending Standards, Credit Markets
When I write this piece weekly, I see my role as a coach who emphasizes some of the essential macro and micro trends in capital markets. Rather than pressing you on what to think, the objection function is the synthesis of trends and how one may think about the totality of data points presented in the chart pack. In its simplest form, the various graphs and trends are an extraction of the essence in markets about what the team at Blue Line is thinking about daily. Thus, I will not go on and on but walk you through the slide deck chronologically.
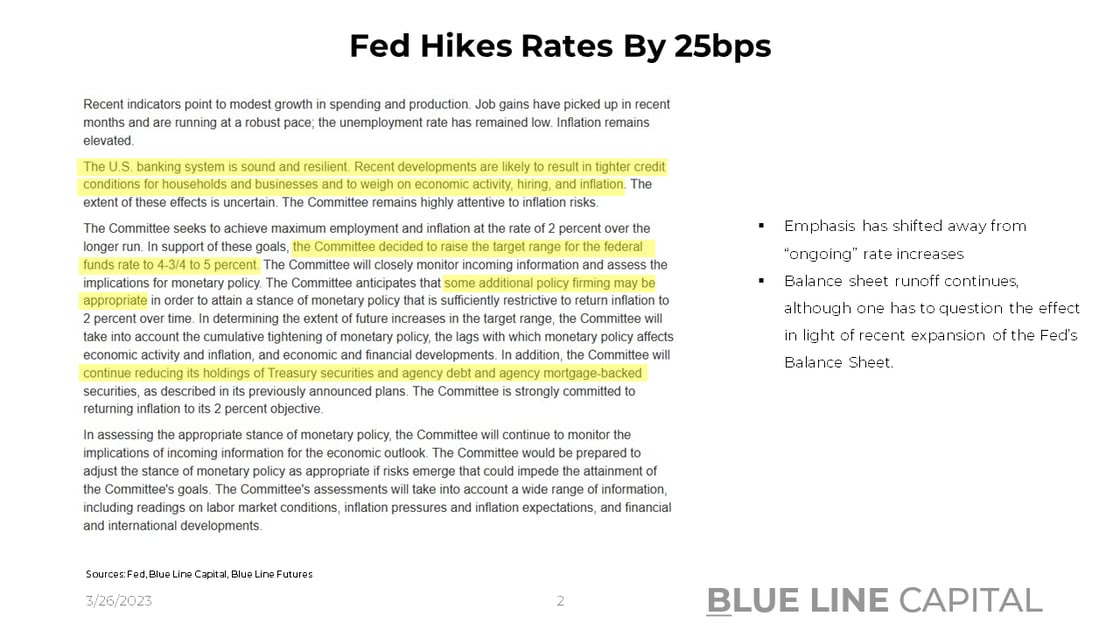
On Wednesday, the Fed hiked by another 25bps with an emphasis on keeping up the balance sheet run-off. However, the asset base of the Fed has expanded in recent weeks amidst the opening of the Fed's discount window and the BTFP facility. Acknowledging that the job market remains tight, the Fed expects unemployment to increase to 4.5% by year-end, anticipating that the "process of getting inflation down to 2% has a long way to go and likely to be bumpy." While Jay Powell's rhetoric may be justified if one took the inflation narrative at face value, there are various reasons to believe that a healthy normalization process is well underway (check out last week's piece for more on inflation trends.)
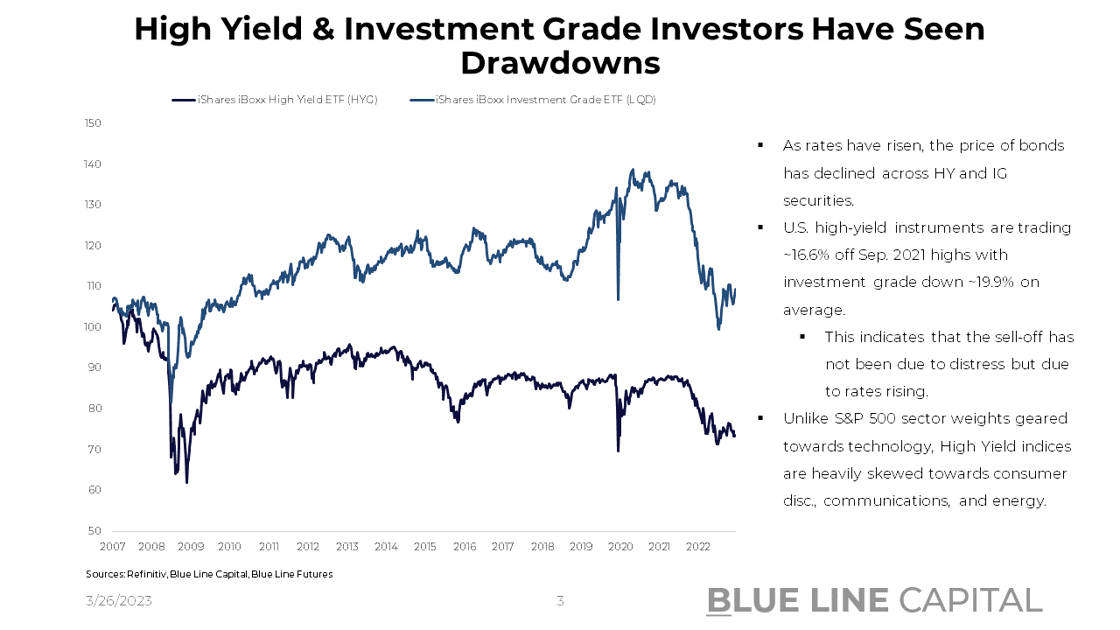
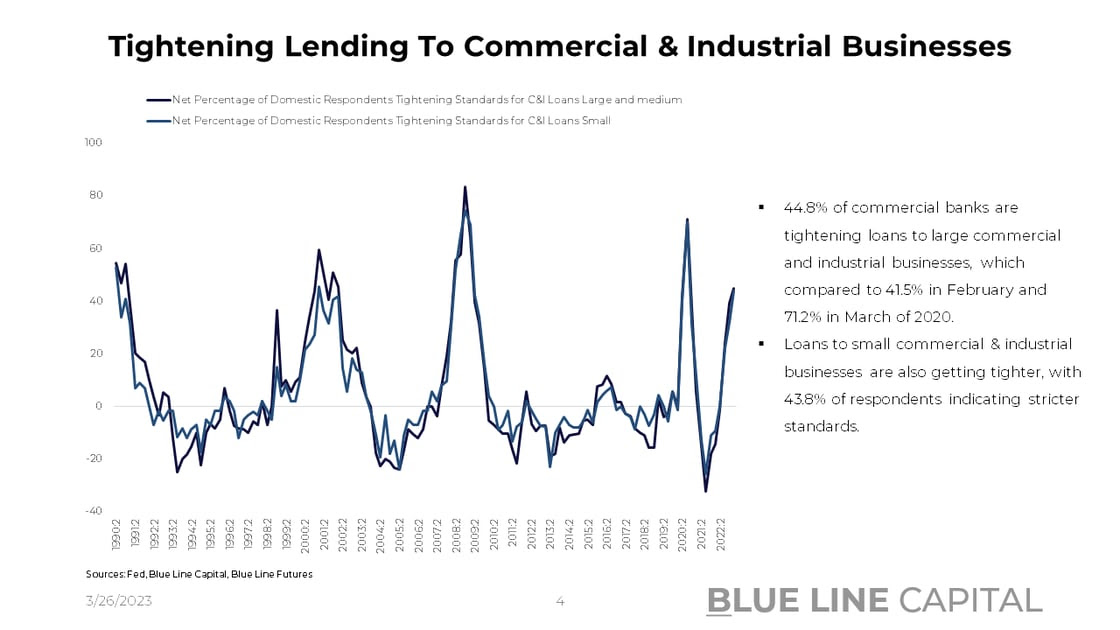
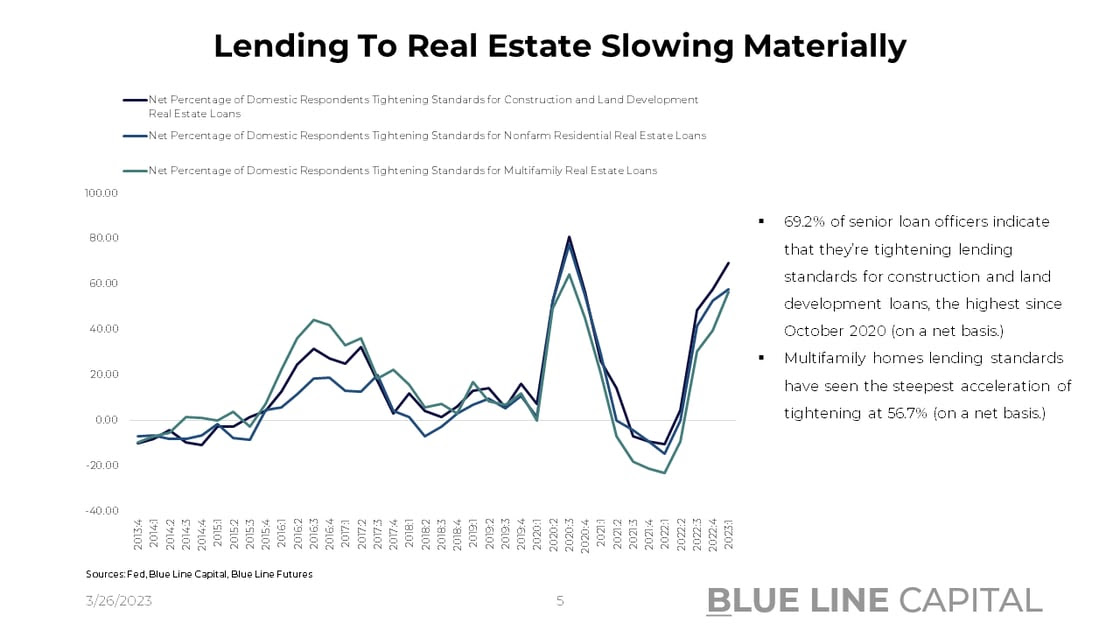
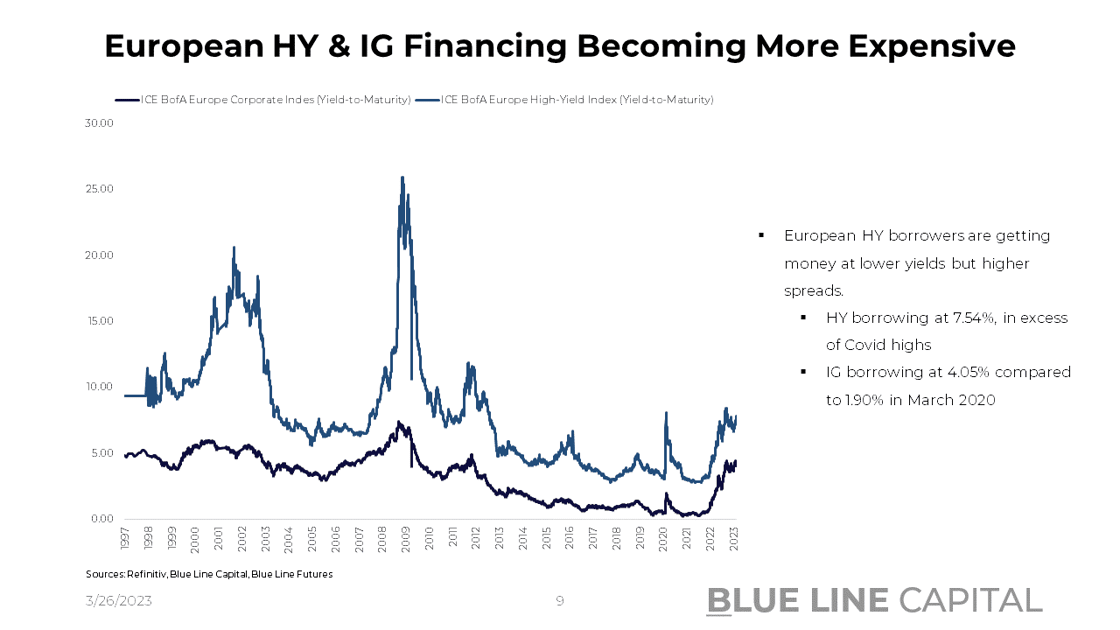
In light of interest rates increasing, high yield and investment grade performance has taken it on the chin, with the iShares High Yield ETF (HYG) down by 16.6% from Sep. 2021 highs, along with the iShares Investment Grade ETF (LQD) down by 19.9%. While some have attributed the weakness to broader stress, we're mainly dealing with an interest rates higher bond prices lower phenomenon despite the significant tightening of lending standards as indicated by the Fed's Senior Loan Officers survey. On net, 44.8% of commercial banks have shown that they have tightened lending to large commercial and industrial businesses, the highest number since March 2020. Lending isn't only becoming stricter in commercial and industrial but also in real estate, where low cap rates continue to look unattractive in light of what one can get risk-free. On net, 69.2% of senior loan officers have indicated that their banks have tightened construction and land development loan standards.
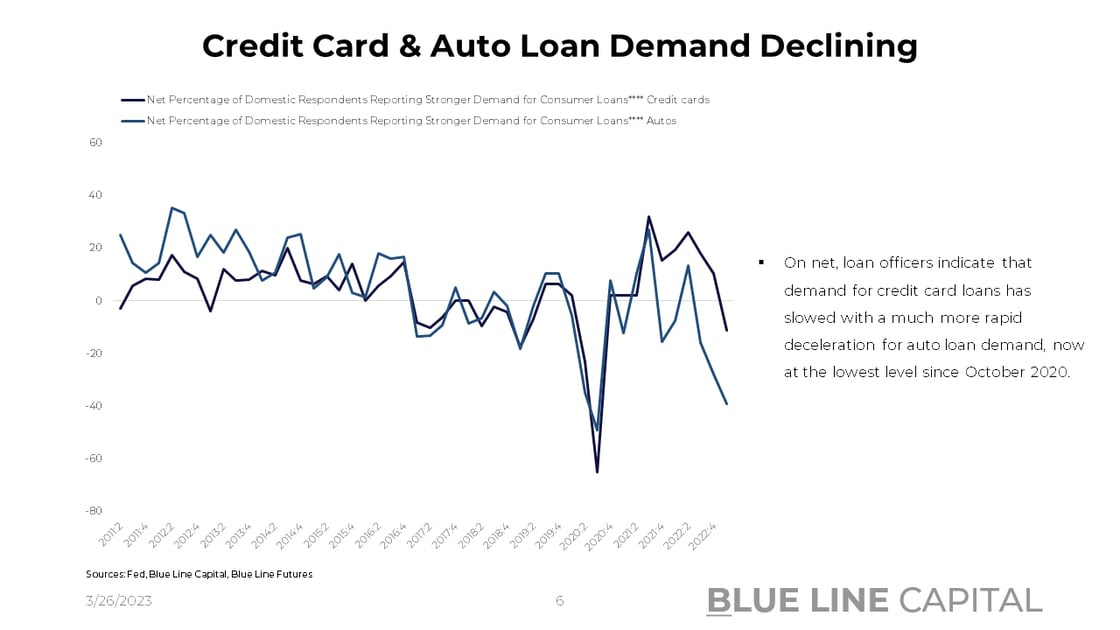
The supply side of loan origination isn't the only place reacting to developments in the banking sector; on net, 11.1% of loan officers have indicated that they see less demand for credit cards, 39.2% of respondents indicating less demand for auto loans. Stress in the auto sector reflects used car prices coming off, translating into much higher loan payments as a percentage of the asset value. If this trend continues, we will likely see some ripples flowing into the Asset-Backed Securities space.
In a flight to safety, money market funds totaled inflows of $159bn from March 13 - 22, the highest inflow since Covid-19 in March 2020. More precisely, from March 20 - 22, there were flows of $66bn into treasury money market funds.
The money has to come from somewhere:
- ) Bank deposits are getting drained.
- ) Investors have sold equities.
- ) Investors have a perception that credit markets are a source of risk.
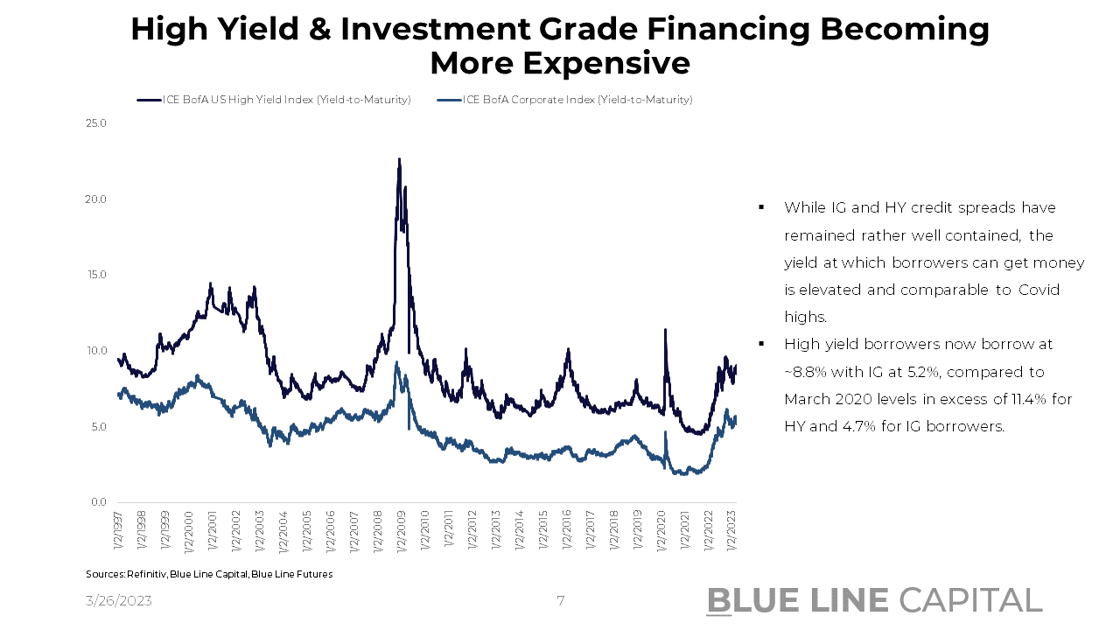
As a result of the flight to safety, yields and credit spreads on U.S. High Yield and Investment Grade securities have expanded. However, one needs to acknowledge that the index weights of those indices are much different from stock indices. According to the economics team at Apollo, 24% of the S&P 500 is Information Technology. In comparison, tech only accounts for 7% of the U.S. high-yield market, primarily driven by consumer discretionary, communications, energy, and financials. The stark difference in the two asset classes has significant potential to distort the broader macro picture.
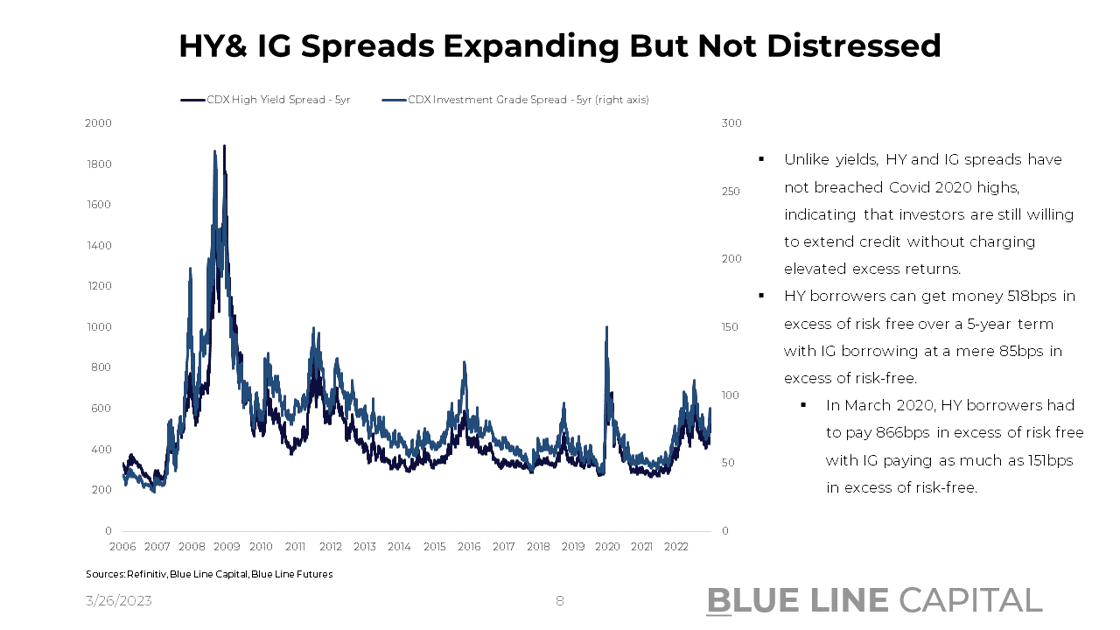
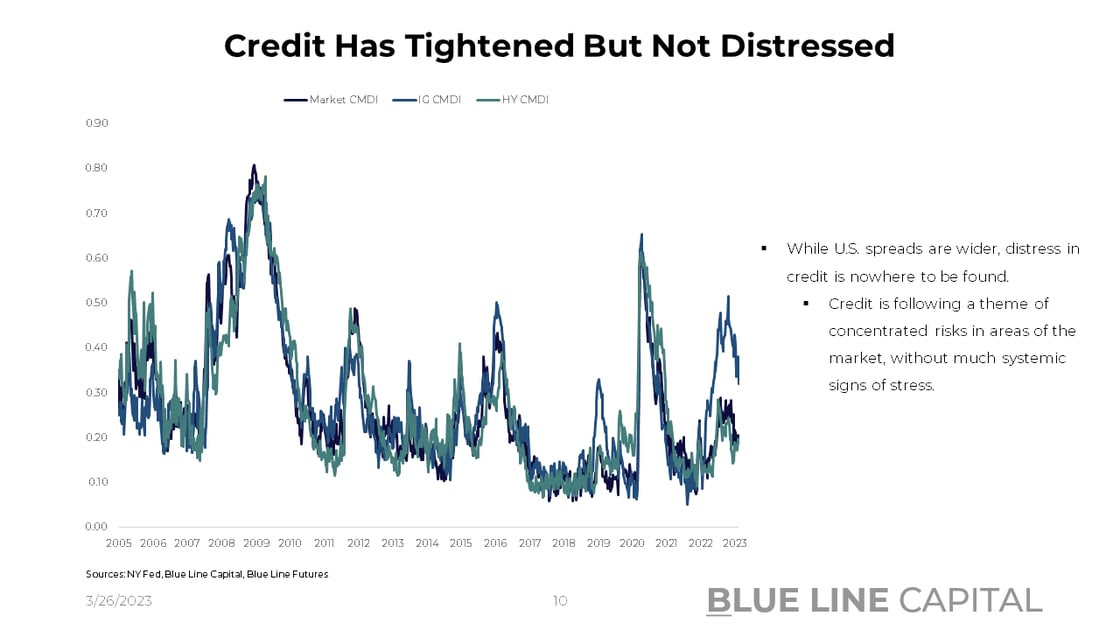
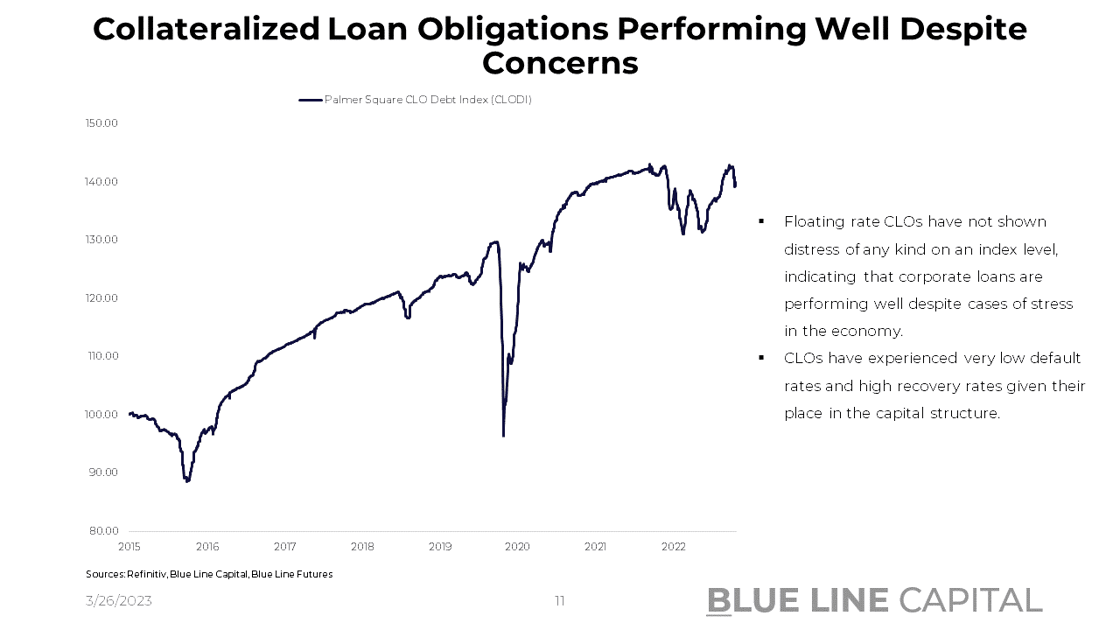
Despite flow trends, the New York Fed's Corporate Distress index is nowhere close to indicating high yield and investment grade distress. Moreover, the CLO market comprised of first-lien bank loans and other collateralized assets high in the capital structure has behaved very constructively. Using the Palmer Square CLO Debt Index (CLODI) as a proxy, investors seek to take advantage of floating-rate loans that enjoy low default and high recovery rates. If there were significant doubt about credit and the economy's overall health, the CLO market would behave very differently.
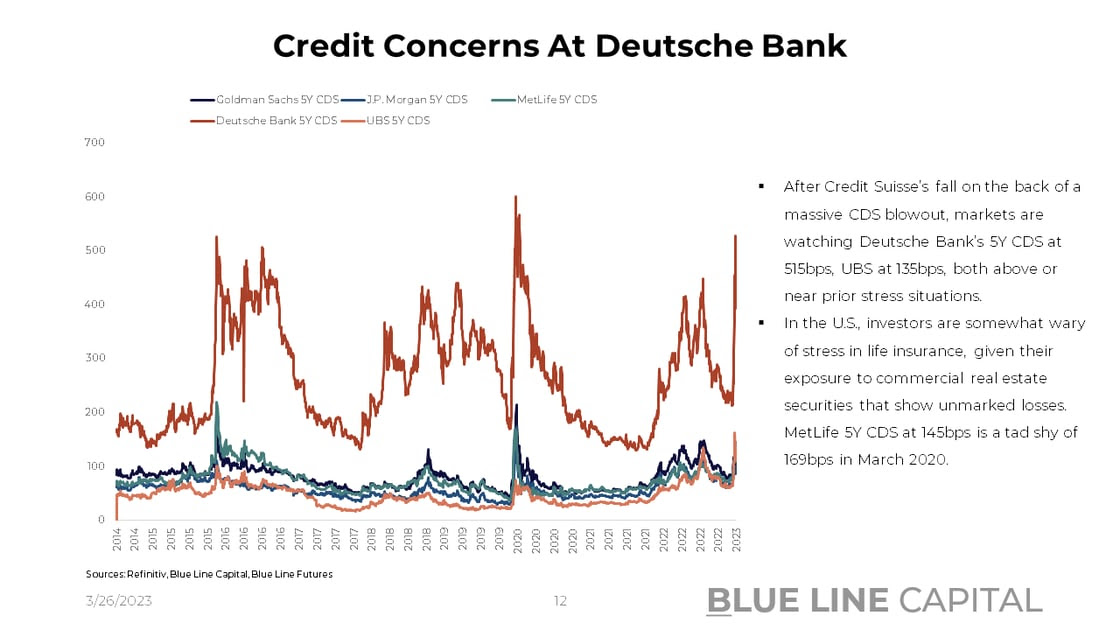
Lastly, the credit default swap market has repeatedly caught investors' eyes over the last 2-4 weeks. Starting with Silicon Valley Bank, Signature, regional banks writ large, and Credit Suisse, investors are now watching Deutsche Bank's 5-year CDS at 515bps, above Covid highs, and near Greek Financial Crisis levels. Moreover, MetLife, a U.S. insurance company has seen its 5Y CDS expand to 145bps, a tad shy of 169bps in March of 2020. While MetLife's CDS is very low in absolute and comparative terms, CMBS holdings on insurance companies' balance sheets concern investors.
Putting it all together, we do know from Goldman and BofA data that investors have de-risked their portfolios, thinking that the opportunity cost in risky assets is too high. We also know, however, that allocations are formed based on assumptions that may or may not be proven correct. If we have a world view that a return to a 2019 regime is possible with relatively isolated instances of stress, there's lots of capital yet to be re-circulated.
Sector Trends
- Credit Card Companies
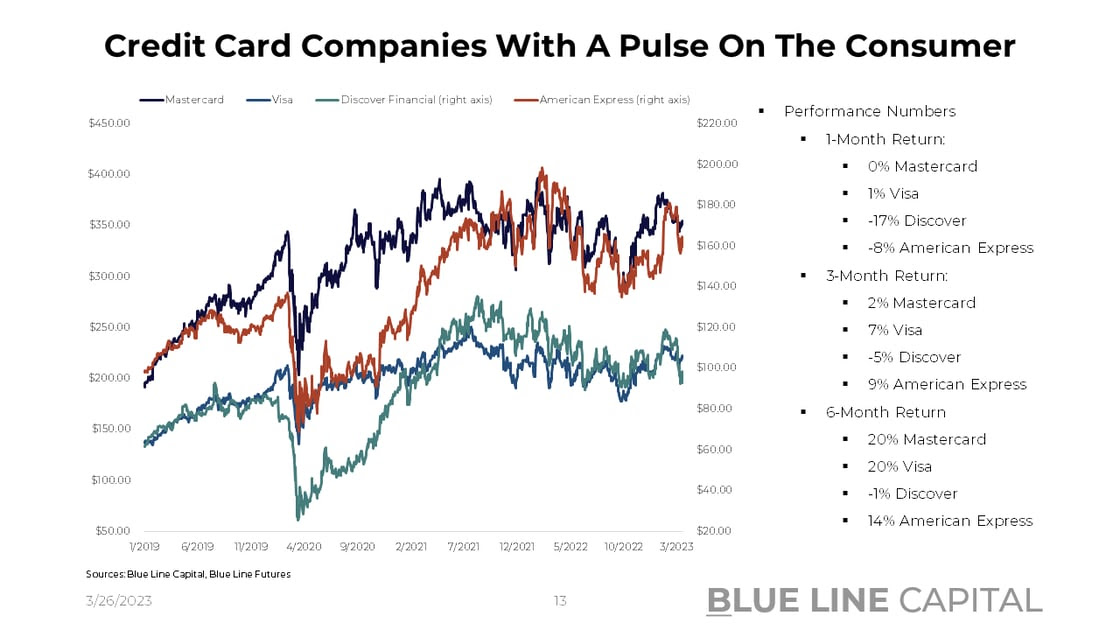
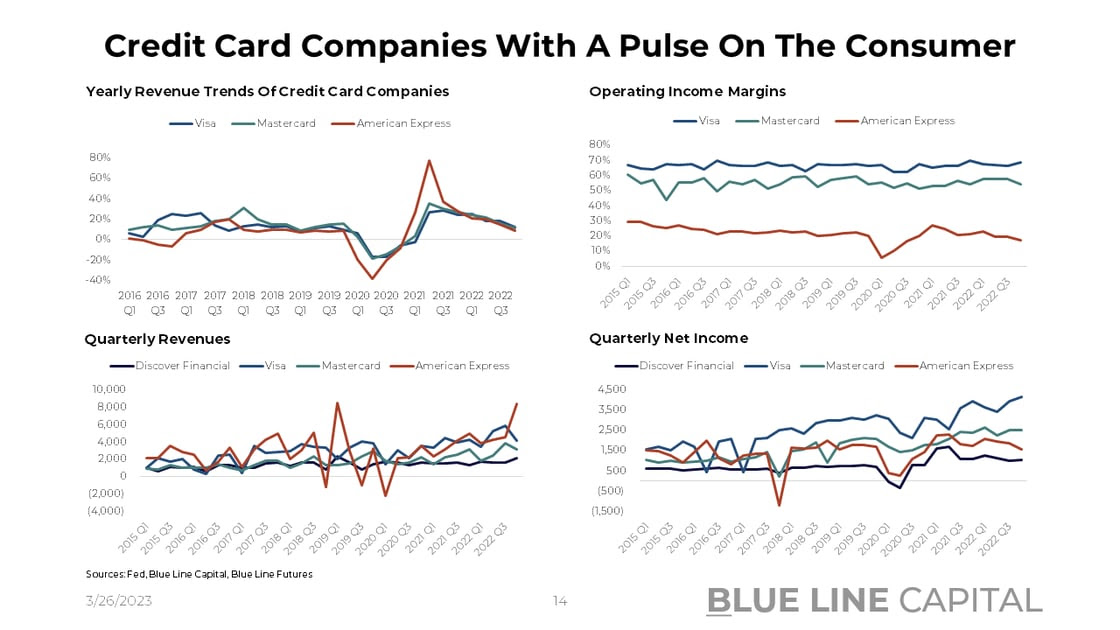
Perceptions can differ drastically from underlying realities. One such divergence is happening with credit card companies with a direct link to consumer spending. Absent consumers using their credit cards and paying their monthly bills, these companies perform poorly. Yet, looking at 1-month, 3-month, and 6-month returns data on Mastercard, Visa, Discover, and American Express, the only stock that's done poorly is Discover while remaining above 2019 levels. Covering the less affluent consumer lends itself to a low NTM P/E of ~6-7 and more exposure to the dominos that fall first. Given that people's credit quality has been overstated in light of transfer payments, Discover will likely take the brunt. Nevertheless, the sector in its aggregate shows high single-digit to low double-digit revenue growth numbers, with indications from both Visa and American Express that their Q1 2023 numbers are trending positively.
- Leisure & Travel
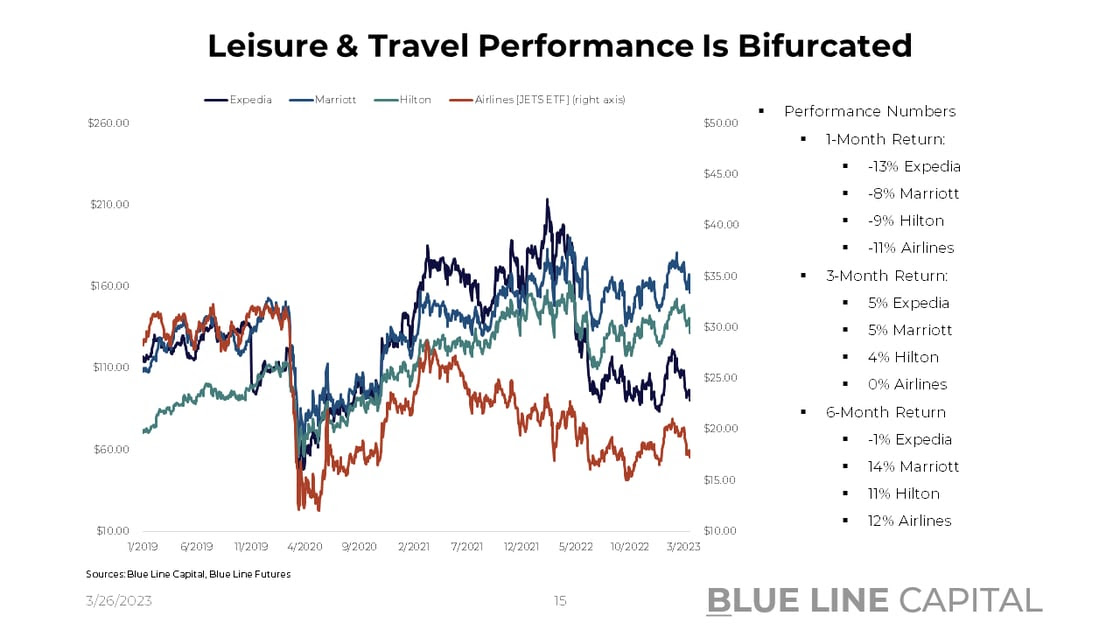
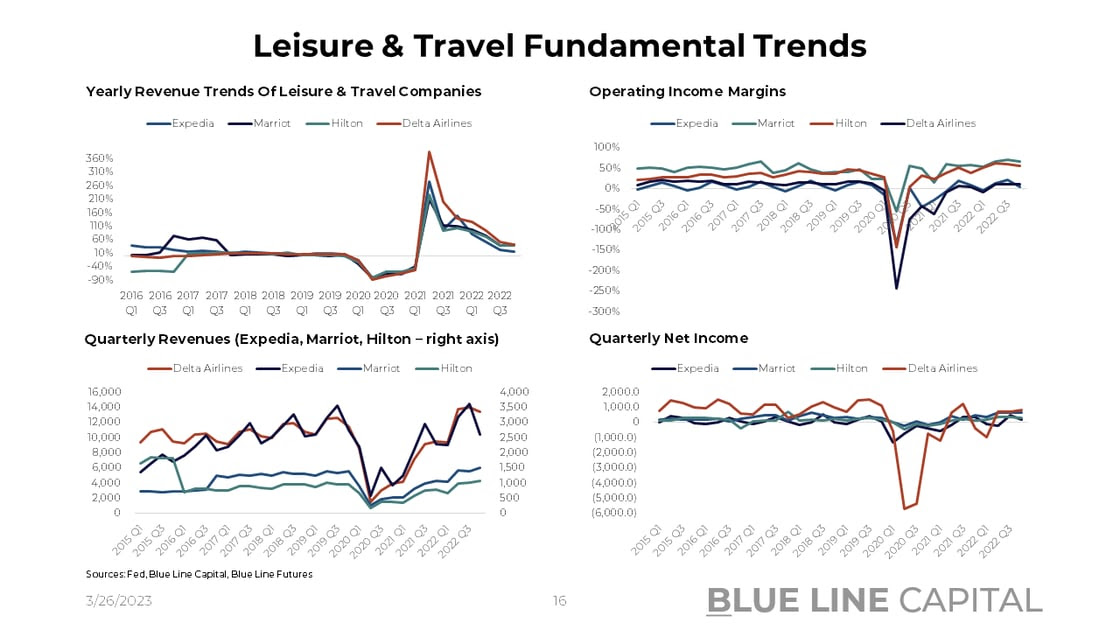
More challenged by underlying structural reasons, airlines have performed poorly despite significantly increasing travel activity. Loaded with debt and prospects that they have to refinance at higher rates, investors are cautious of high default industries. Online travel agency operators like Expedia have followed suit, down 13% over the last month and below pre-Covid levels. However, not all leisure & travel companies are created equal; Hilton and Marriott, for instance, are down in the high-single digits over the last month but are up by low double digits over the previous six months, indicative of travel tailwinds.
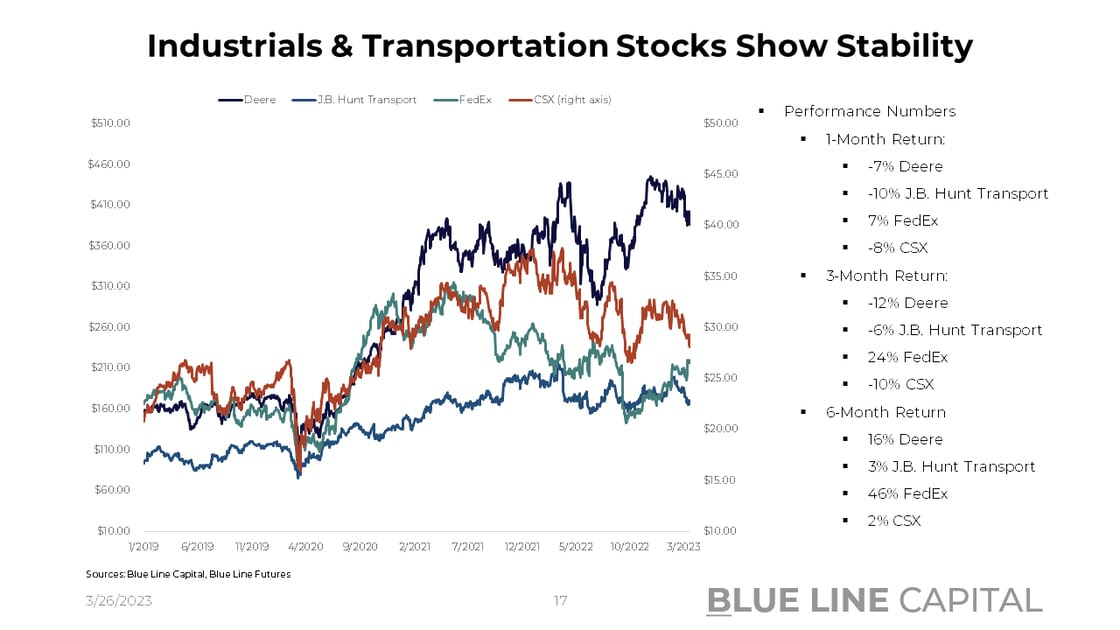
- Industrials & Transportation
With a direct link to actual economic activity in manufacturing, goods consumption, and industrial production, industrial & transportation stocks are a significant piece of the puzzle. While sounding the alarm early on, FedEx has underpromised and over-delivered, with the stock up 7% over the last month, up 24% over three months, and up 46% in the previous six months. While Deere and J.B. Hunt Transport are off their highs, they have rallied significantly from Covid lows, appearing to be priced for higher cash flows. The year-over-year deceleration of revenues is unsurprising but could indicate the worst is behind these companies.
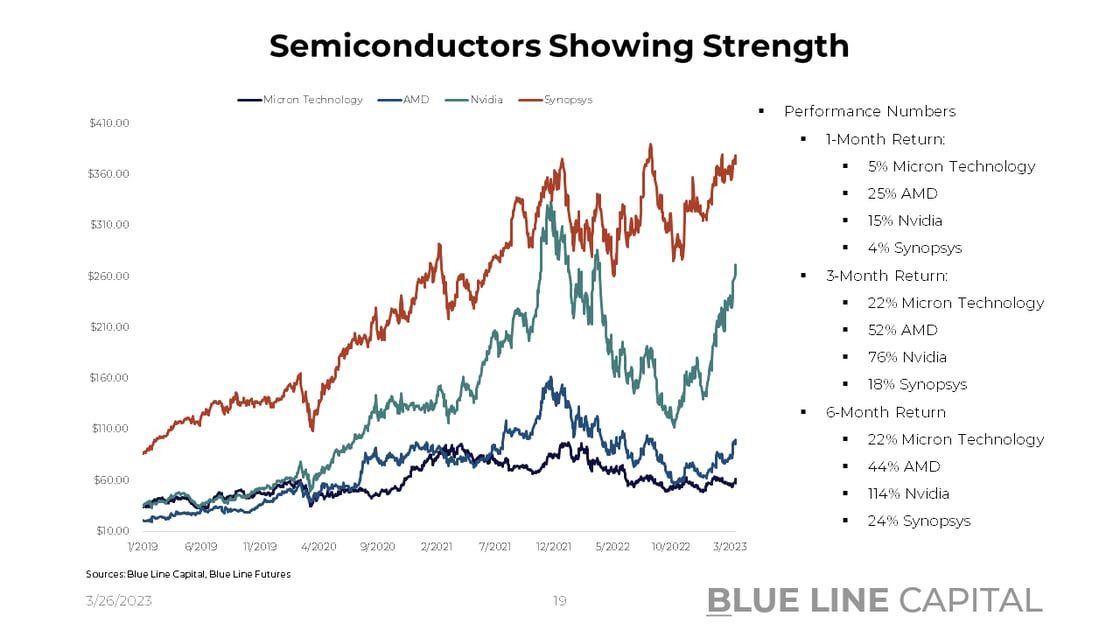
- Semiconductors
Diverging from the rest of the pack, semiconductors have fared exceptionally well, with Nvidia up 114% over the last six months. After a significant revenue deceleration in Q4 2022 (Nvidia -21%, AMD - 24%, Micron -47%), the equities have front-run a business cycle acceleration, which is also indicated by South Korean export data, which has taken a hit, but set to recover from here.
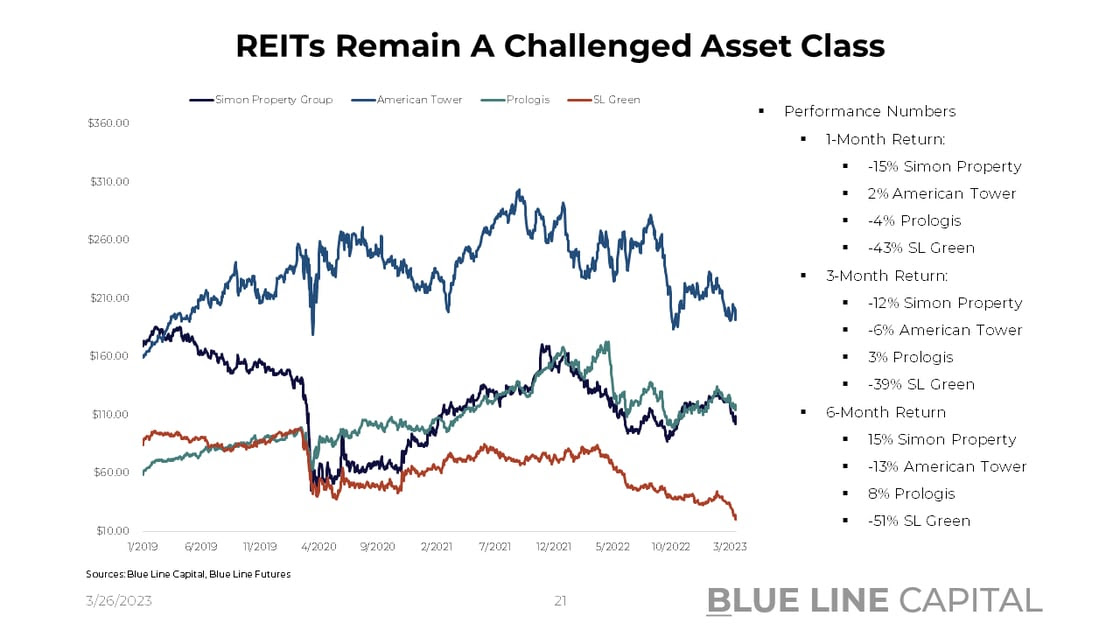
- REITs
Less positive is the picture in real estate where low-quality offices and high-quality REITs like American Tower with high multiples have done poorly. SL Green, a New York office REIT, is down 43% in the last month, while American Tower has trended sideways since late 2019.
If there are isolated sectors with stress, which are inevitable in the renormalization process, sector-level awareness will be paramount in optimizing portfolio returns.
Please find more information in our chart pack. All the weekly data releases will be covered in our daily Morning Express, authored by Bill Baruch.
Don't miss Episode 12 of our Triple Play Podcast -- Bill Baruch and Jannis Meindl share their thoughts on Illumina, Intuit, and Pioneer Natural Resources.
Chart-Pack Macro Slides
|
Stay tuned for Episode 13 of Triple Play! |
Until next time, good luck & good trading.
Be sure to check out prior writing of Top Things to Watch this Week:
- The Inflation Review With Consumer Prices, Producer Price And Other Inflation Trends - Mar. 19, 2023
- Gaining Clarity In The Fog Of War (Silicon Valley Bank's Duration Wipeout) - Mar. 13, 2023
- 2023, A Macro Safari En-Route 2019 - Mar. 5, 2023
Our Blue Line Futures Trade Desk is here to talk about positioning, idea and strategy generation, assisted accounts, and more! Don't miss our daily Research with actionable ideas (Click Here To Sign Up)
Schedule a Consultation or Open your free Futures Account today by clicking on the icon above or here. Email info@BlueLineFutures.com or call 312-278-0500 with any questions!
Economic Calendar
U.S.
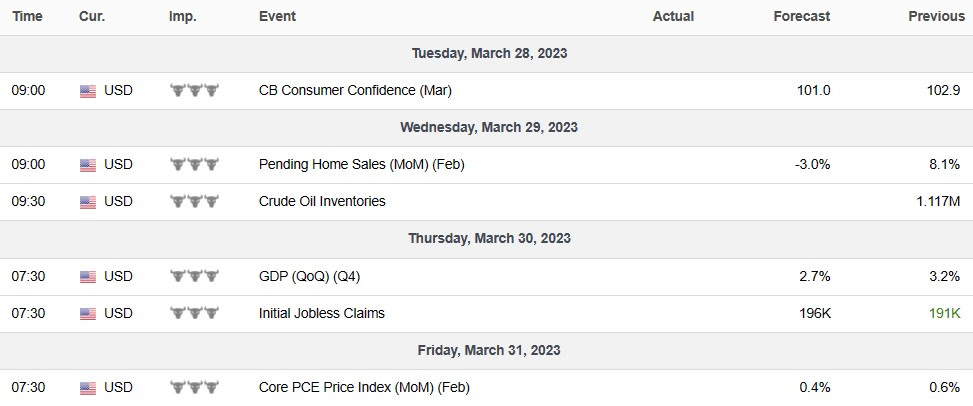
Data Release Times (C.T.)
China
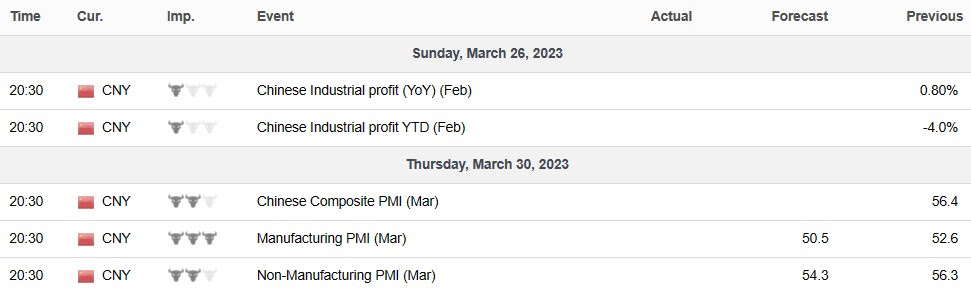
Data Release Times (C.T.)
Eurozone
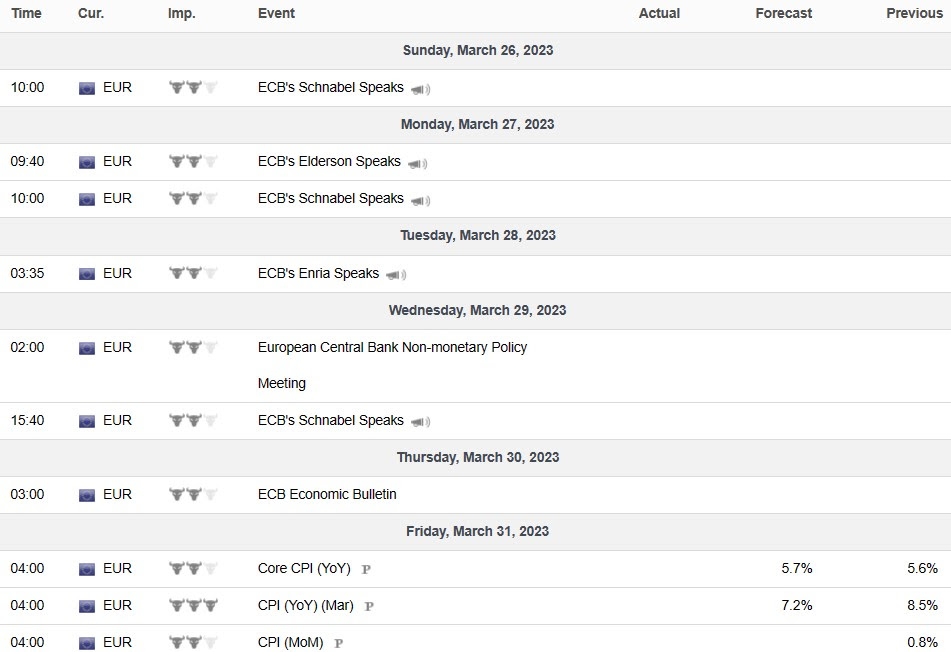
Data Release Times (C.T.)
More Of The Upcoming Economic Data Points Can Be Found Here.
Blue Line Capital
If you have questions about any of the earnings reports, our wealth management arm, Blue Line Capital, is here to discuss! Email info@bluelinecapllc.com or call 312-837-3944 with any questions! Visit Blue Line Capital's Website
Sign up for a 14-day, no-obligation free trial of our proprietary research with actionable ideas!
Free Trial
Start Trading with Blue Line Futures
Subscribe to our YouTube Channel
Email info@Bluelinefutures.com or call 312-278-0500 with any questions -- our trade desk is here to help with anything on the board!
Futures trading involves substantial risk of loss and may not be suitable for all investors. Therefore, carefully consider whether such trading is suitable for you in light of your financial condition. Trading advice is based on information taken from trade and statistical services and other sources Blue Line Futures, LLC believes are reliable. We do not guarantee that such information is accurate or complete and it should not be relied upon as such. Trading advice reflects our good faith judgment at a specific time and is subject to change without notice. There is no guarantee that the advice we give will result in profitable trades. All trading decisions will be made by the account holder. Past performance is not necessarily indicative of future results.
Blue Line Futures is a member of NFA and is subject to NFA’s regulatory oversight and examinations. However, you should be aware that the NFA does not have regulatory oversight authority over underlying or spot virtual currency products or transactions or virtual currency exchanges, custodians or markets. Therefore, carefully consider whether such trading is suitable for you considering your financial condition.
With Cyber-attacks on the rise, attacking firms in the healthcare, financial, energy and other state and global sectors, Blue Line Futures wants you to be safe! Blue Line Futures will never contact you via a third party application. Blue Line Futures employees use only firm authorized email addresses and phone numbers. If you are contacted by any person and want to confirm identity please reach out to us at info@bluelinefutures.com or call us at 312- 278-0500
Like this post? Share it below:
Back to Insights
In case you haven't already, you can sign up for a complimentary 2-week trial of our complete research packet, Blue Line Express.
Free Trial