The Fed's Preferred Inflation Indicator & Energy Markets | Top Things to Watch this Week
Posted: Feb. 27, 2023, 2:04 p.m.
The Fed's Preferred Inflation Indicator & Energy Markets
"A great many people think they are thinking when they are merely rearranging their prejudices." - William Jones
Chart Booklet & More
Access this week's chart booklet leading with PCE data and a deep dive into inventory & spending dynamics in energy. We also cover in-depth corporate trends with John Deere, Raytheon, and Marvell. We will provide an updated chart-book with more data on corporate trends when we release Triple Play Episode 9!
Bill Baruch joined CNBC's Halftime Report on Thursday, talking about the importance of being selective in today's market environment.
Triple Play Podcast
Don't miss episode 8 of our Triple Play Podcast! Bill Baruch and Jannis Meindl talk about the latest macro trends and share 3 actionable stock ideas.

Macro Dynamics
PCE Trends
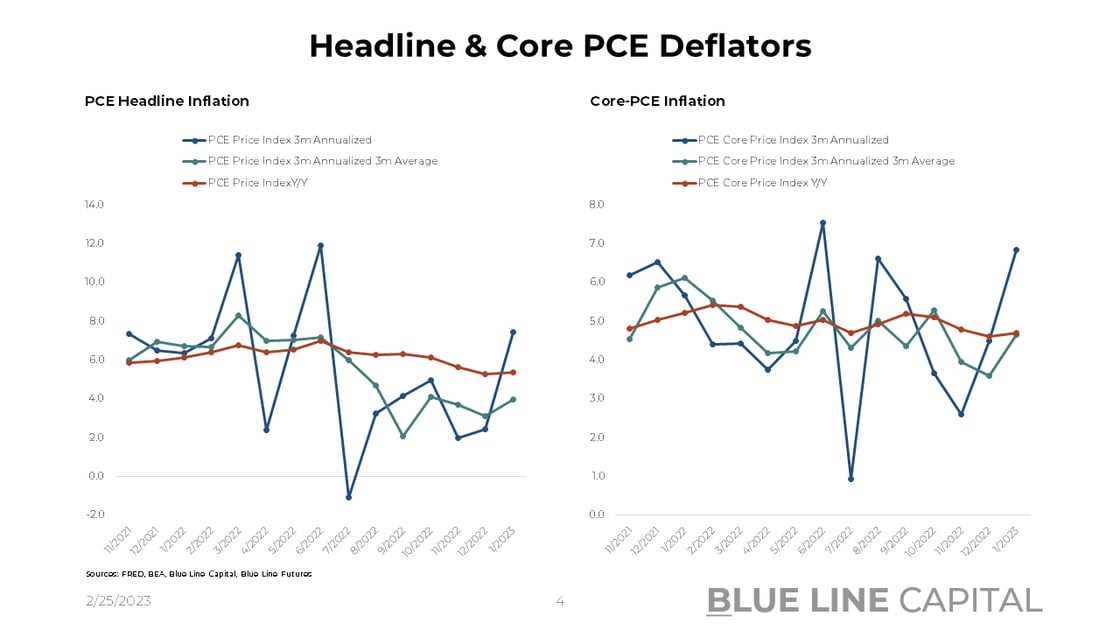
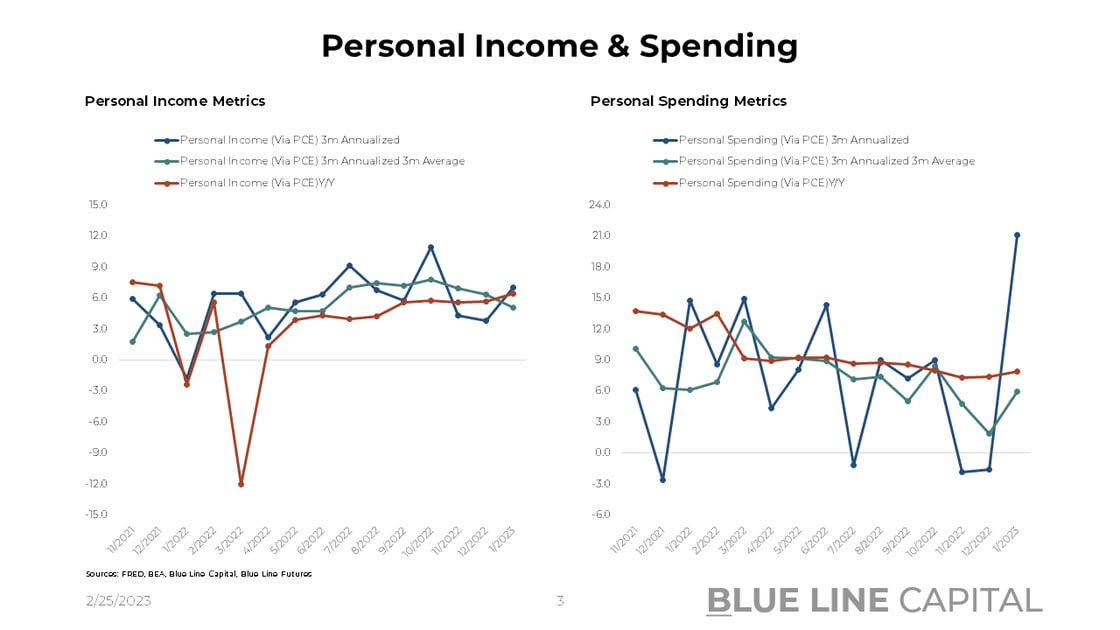
At 0.6% M/M for core and headline PCE, the Fed's preferred inflation indicator followed in CPI's and PPI's footsteps, coming in on the higher end of what economists had expected. Moreover, personal spending at 1.8% M/M followed what we already saw with Retail Sales increasing by 3% M/M in January. On the lower end, personal income only rose by 0.6% M/M despite strong spending and inflation trends. While one data point doesn't make a trend, the consumer's health will depend on how fast inflation can slow vs. how much wages can rise. Despite Y/Y PCE accelerating to 5.4%, personal income at 5.9% annualized over the last three months bodes positively for employees and their bargaining power relative to employers.
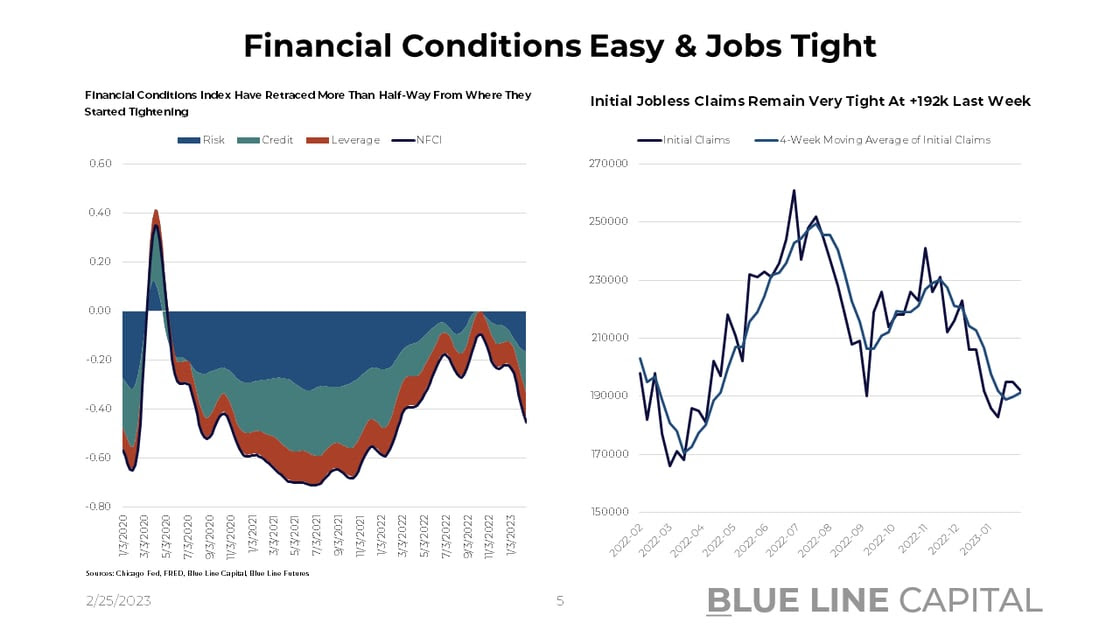
More importantly, though, additional monetary action could be necessary, with initial jobless claims nowhere near recession territory at +192k last week and a massive easing of financial conditions. The inflation mindset is called behavioral for a reason. Once the psyche around higher prices gets entrenched, employees are reluctant to pull back on their demands for higher income. As a result, margins get squeezed (look at Home Depot & Walmart), and spending shifts from discretionary to non-discretionary items.
Given that the last 2-3 years have led to a whole gambit of data distortions, it is questionable whether January's hot data points will be confirmed in February.
Below, we provide a bottom-up view of the energy market, but if you want to save time and skip to our chart pack, please feel free to do so.
Take advantage of last week's Triple Play Podcast, where Bill Baruch and Jannis Meindl cover the latest macro and corporate trends.
Energy Markets Data Digestion
It's been a while since we included a commodities-focused section in this write-up, so let's get granular again. Given where everything from international politics to domestic production stands, let's first level-set and understand how the energy supply chain works.
First, companies like Halliburton & Schlumberger help individual owners of land or larger corporates explore & expand resource projects. Land in the Permian? We should find out if there's oil or gas, so the landowner can either lease the land to an upstream producer or drill some wells with the help of oil equipment providers (Halliburton & Schlumberger.) If you are offshore and want to drill for oil in the Gulf of Mexico, the picture is a bit more complex, given it takes significant capital commitments to explore, develop and drill for oil on an offshore rig. Instead of a well in the Permian, you also rely on companies like Transocean or Valaris, who can provide you with an offshore oil platform at a rate of ~$400,000/day. Once you've figured out where the oil is and the geological work is complete, you can start drilling and transporting the oil to export hubs or directly to refineries that turn the oil into end-products such as gasoline, jet fuel, or heating oil (there are many more.) In areas like the Permian, companies like Energy Transfer will provide the necessary pipeline infrastructure to transport the oil. With offshore projects, operators tend to contract undersea pipeline operators that assist with transportation.
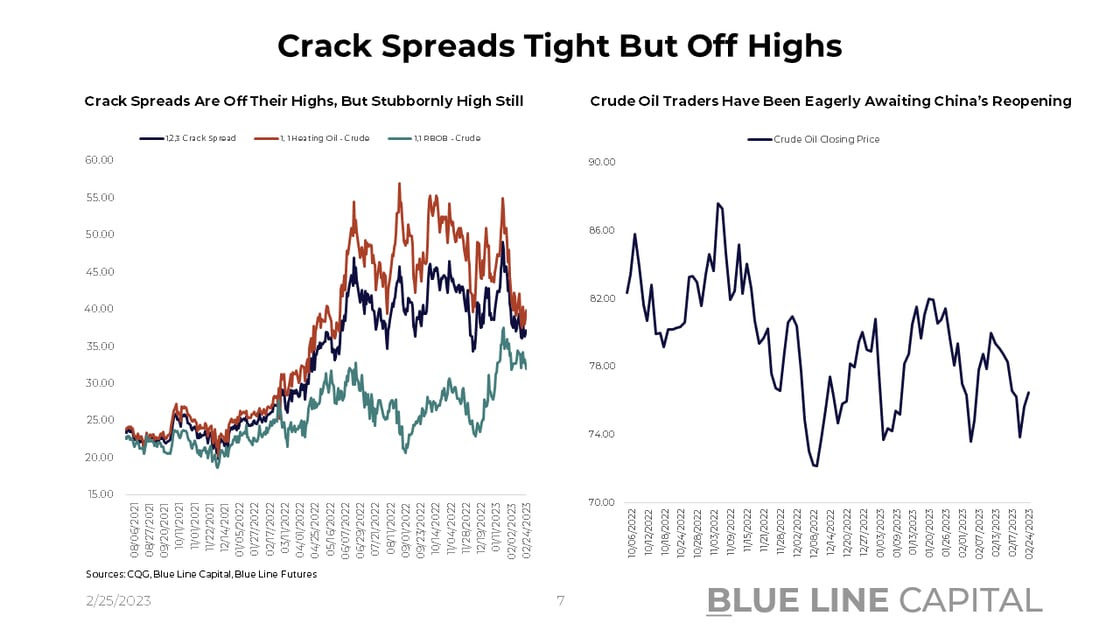
Once the oil is transported to the export hub or the refinery, the offtake depends on available capacity; are there enough ships and refinery capacity to take the oil overseas or turn it into end-products? The answer as to whether there's enough capacity is directly reflected in crack spreads, a spread between end-product prices and crude oil -- a higher spread indicates inadequate capacity. Once the product is refined, the country's pipeline infrastructure, truckers, or rails will make sure the end product gets to the consumer.
As you can see, this is a multi-step process, which looks similar for natural gas, except that the LNG needs to get liquified and re-gasified at various steps in the process of transportation.
In any case, available capacity depends on the return investors can earn, which means the higher past returns, the higher the investment appetite will be. After experiencing a rapid price slump during the GFC, investors were caught in another supply surplus situation due to the shale revolution. As drilling became much cheaper, OPEC decided to engage in a full-blown volume war, determined to put competitors out of business. OPEC drove prices to the $25/bbl mark, and defaults across the E&P skyrocketed. Investors' wallets got emptied, and they've hesitated to return. Moreover, companies have hesitated to deploy capital into new projects and prefer returning money to investors.
For context, Exxon Mobil spent $36.5bn over the course of 12 months in 2013; the company has spent a third in the last 4 quarters. Chevron and most other operators show a similar spending profile. Oil service companies have taken even more drastic steps. Spending more than $3.7bn during the shale boom, Halliburton only spent $661 million in the last 12 months; Schlumberger's capital spending profile looks even more drastic. Offshore drillers, including Transocean and Valaris, have taken massive steps to reduce spending, too, merely trying to stay solvent.
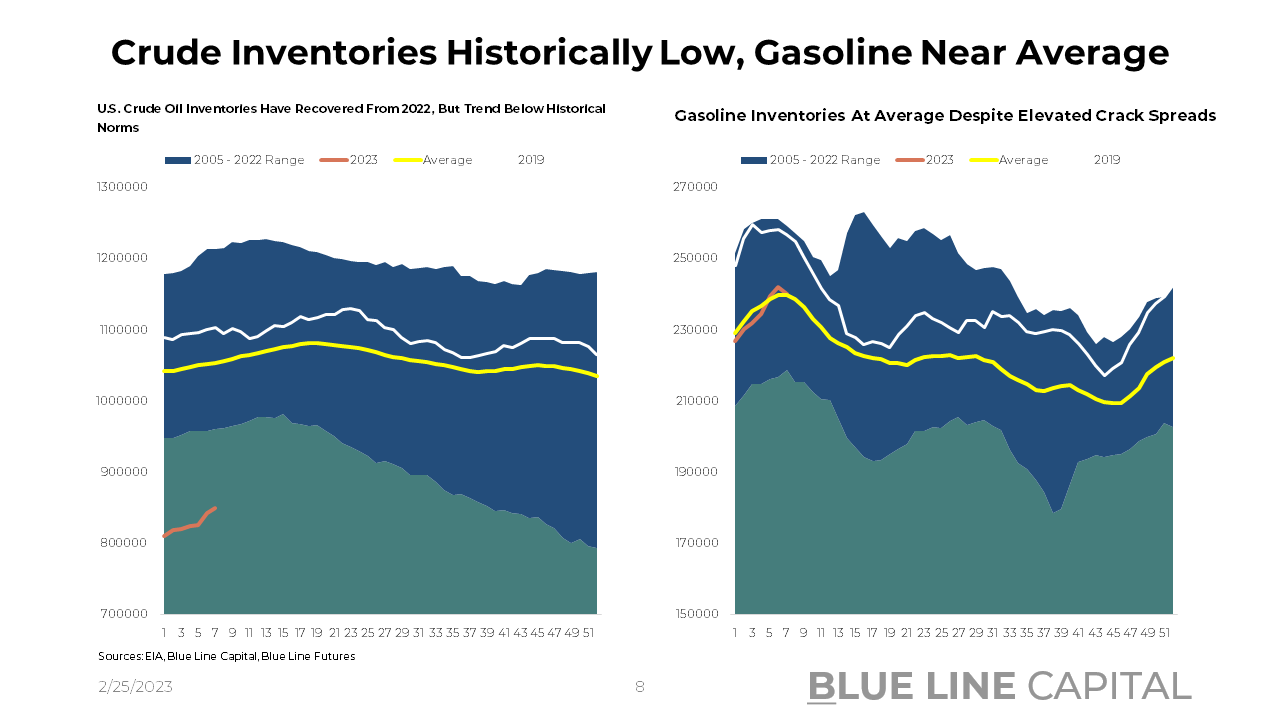
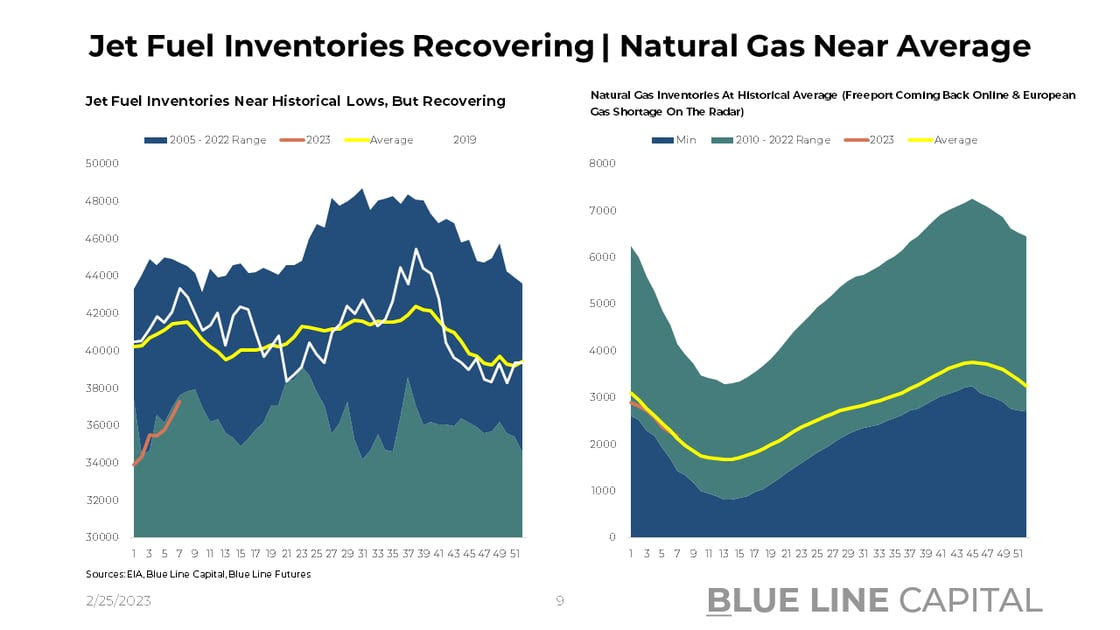
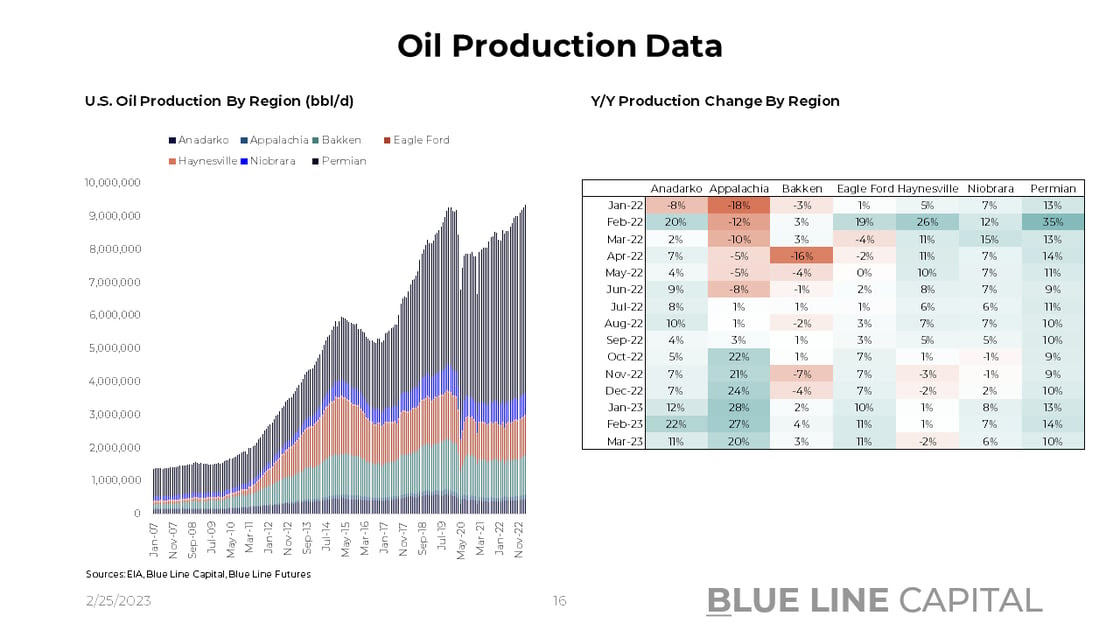
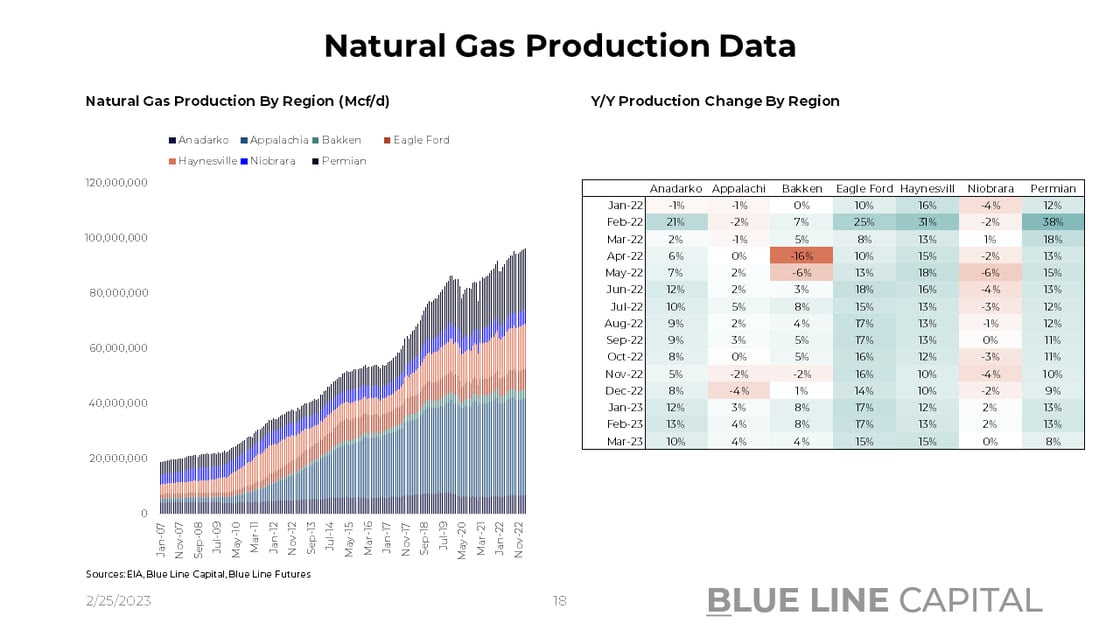
When companies try to return capital to shareholders rather than drill, it is unsurprising that U.S. crude oil inventories are far below their 2005 - 2022 range. Similarly, a lack of refinery capacity has translated into jet fuel inventories near the low end of the historical range, while gasoline inventories show a much friendlier picture. Like gasoline, natural gas inventories are robust despite a global LNG shortage, which has primarily been mitigated given a mild winter in Europe, a lack of activity in China, and Freeport going offline in the United States.
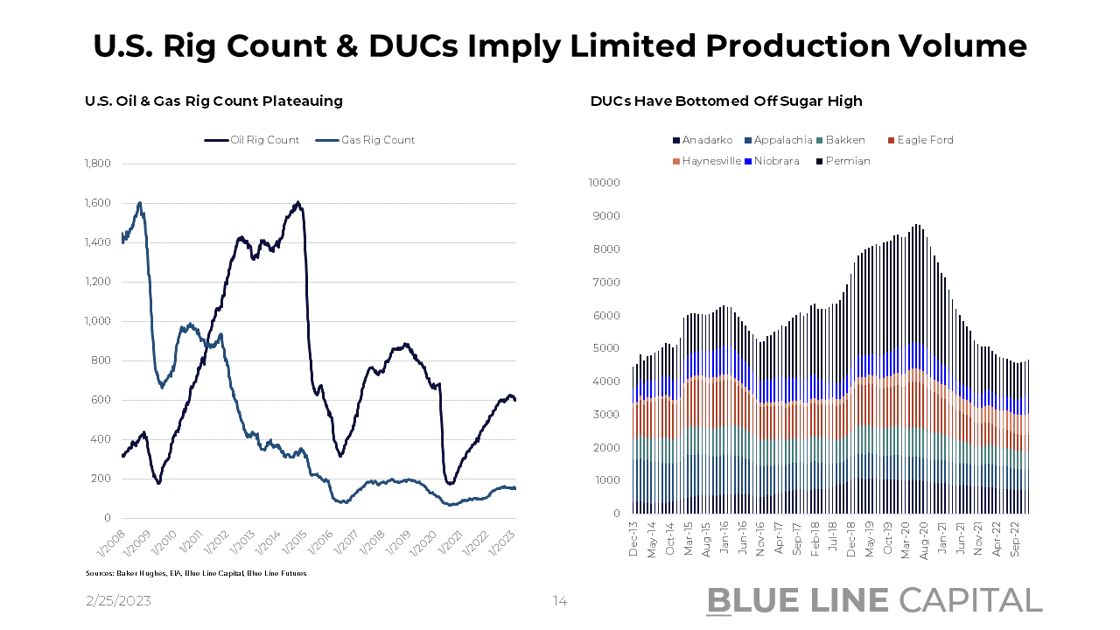
All in all, a bet against volume increases is a bet against technology advancements, which is undoubtedly a tough bet to make in any setting. Nevertheless, wells don't drill themselves, with only 600 active oil rigs in the U.S. compared to ~870 rigs in 2019 and nearly 1,600 oil rigs during the shale boom in 2015.
With Chinese consumers having doubled their household savings from 2021, the demand push from APAC should put upside pressure on demand while living standards keep increasing worldwide. With OPEC projecting an annual increase of 1.1% in China's oil consumption with India at 4% until 2035, OPEC's assumption of 1.8% for other non-OECD members appears too low. Similarly, non-OECD natural gas consumption growth at 3% seems understated.
With 370 metric tons of global natural gas regasification under construction, new technologies will help drive higher volume while a lack of investment will counterweight supply increases.
Don't miss Episode 8 of our Triple Play Podcast -- Bill Baruch and Jannis Meindl share their thoughts on a value stock, housing, and semiconductors.
Be sure to access our weekly chart-pack with everything from credit spreads to in-depth corporate trends in pharma, streaming and chips.
Chart-Pack Macro Slides


Stay tuned for Episode 8 of Triple Play!
Until next time, good luck & good trading.
Be sure to check out prior writing of Top Things to Watch this Week:
- Making Sense of Inflation & Spending Data - Feb. 19, 2023
- Cognitive Dissonance Pre-CPI - Feb. 12, 2023
- The Fed & Nonfarm Payrolls - Feb. 6, 2023
Our Blue Line Futures Trade Desk is here to talk about positioning, idea and strategy generation, assisted accounts, and more! Don't miss our daily Research with actionable ideas (Click Here To Sign Up)
Schedule a Consultation or Open your free Futures Account today by clicking on the icon above or here. Email info@BlueLineFutures.com or call 312-278-0500 with any questions!
Economic Calendar
U.S.

Data Release Times (C.T.)
China
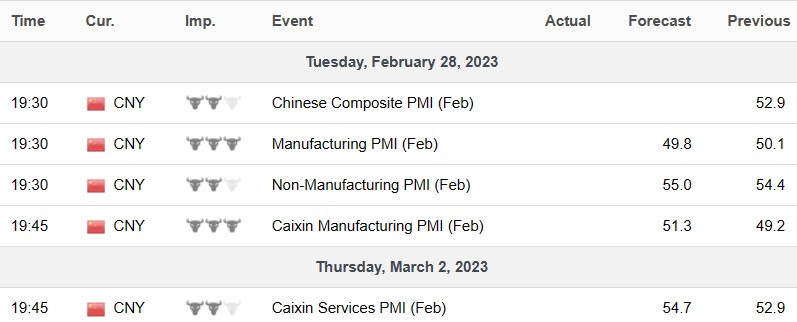
Data Release Times (C.T.)
Eurozone
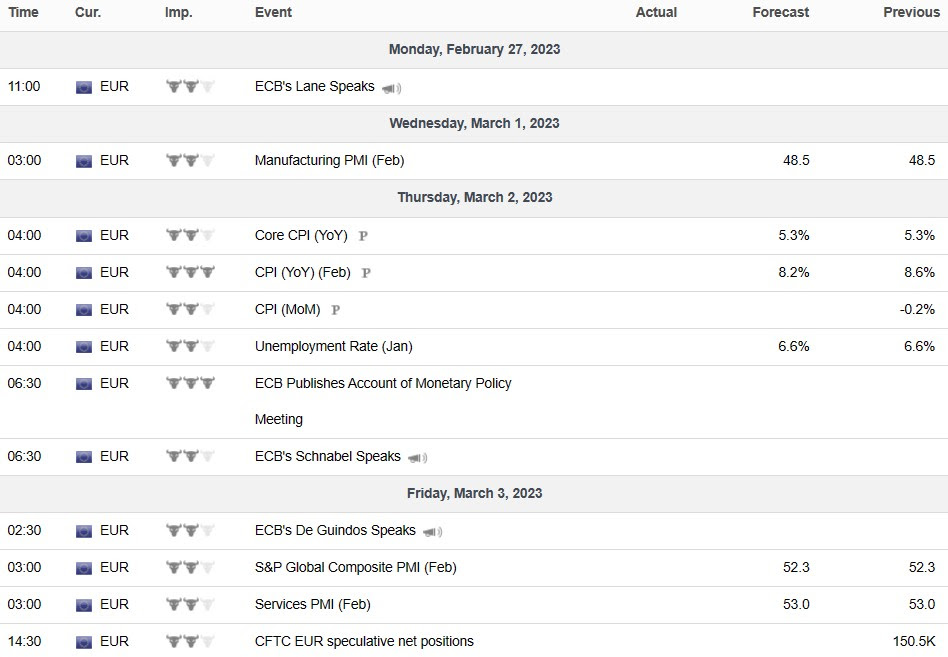
Data Release Times (C.T.)
More Of The Upcoming Economic Data Points Can Be Found Here.
Food for Thought
Blue Line Capital
If you have questions about any of the earnings reports, our wealth management arm, Blue Line Capital, is here to discuss! Email info@bluelinecapllc.com or call 312-837-3944 with any questions! Visit Blue Line Capital's Website
Sign up for a 14-day, no-obligation free trial of our proprietary research with actionable ideas!
Free Trial
Start Trading with Blue Line Futures
Subscribe to our YouTube Channel
Email info@Bluelinefutures.com or call 312-278-0500 with any questions -- our trade desk is here to help with anything on the board!
Futures trading involves substantial risk of loss and may not be suitable for all investors. Therefore, carefully consider whether such trading is suitable for you in light of your financial condition. Trading advice is based on information taken from trade and statistical services and other sources Blue Line Futures, LLC believes are reliable. We do not guarantee that such information is accurate or complete and it should not be relied upon as such. Trading advice reflects our good faith judgment at a specific time and is subject to change without notice. There is no guarantee that the advice we give will result in profitable trades. All trading decisions will be made by the account holder. Past performance is not necessarily indicative of future results.
Blue Line Futures is a member of NFA and is subject to NFA’s regulatory oversight and examinations. However, you should be aware that the NFA does not have regulatory oversight authority over underlying or spot virtual currency products or transactions or virtual currency exchanges, custodians or markets. Therefore, carefully consider whether such trading is suitable for you considering your financial condition.
With Cyber-attacks on the rise, attacking firms in the healthcare, financial, energy and other state and global sectors, Blue Line Futures wants you to be safe! Blue Line Futures will never contact you via a third party application. Blue Line Futures employees use only firm authorized email addresses and phone numbers. If you are contacted by any person and want to confirm identity please reach out to us at info@bluelinefutures.com or call us at 312- 278-0500
Like this post? Share it below:
Back to Insights
In case you haven't already, you can sign up for a complimentary 2-week trial of our complete research packet, Blue Line Express.
Free Trial