Is Growth Following Inflation Lower? | Top Things to Watch this Week
Posted: Jan. 23, 2023, 8 a.m.
Is Growth Following Inflation Lower? | Top Things to Watch this Week
"An action committed in anger is an action doomed to failure." - Genghis Khan
Chart Booklet
Access this week's chart booklet leading with a decomposition of the latest PPI report, recent growth data, and much more. We also cover in-depth corporate trends as we share insights on Thermo Fisher, CSX and Cheniere Energy (we will publish an updated chart booklet in the description of our next Triple Play.)
Triple Play Podcast
Don't miss the third episode of our Triple Play Podcast! Bill Baruch and Jannis Meindl talk about the latest macro trends and share 3 actionable stock ideas.

PPI, Growth Data & Commodities Commentary
PPI Report Commentary
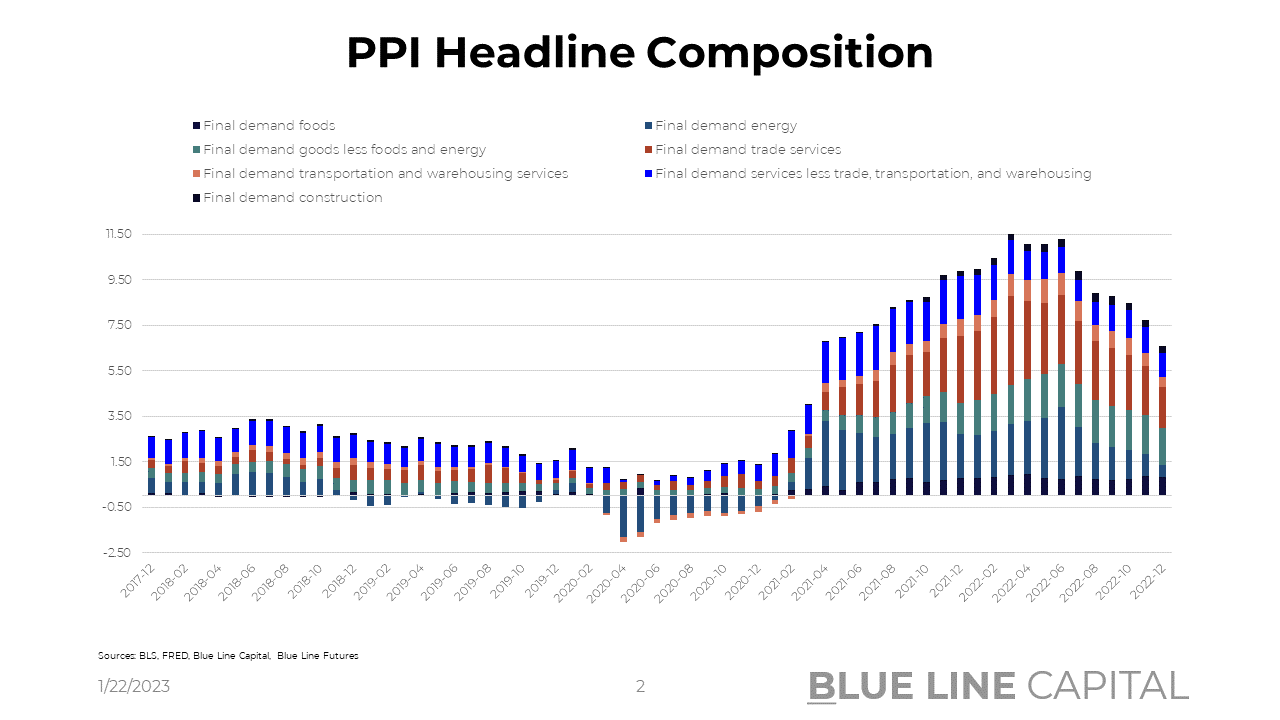
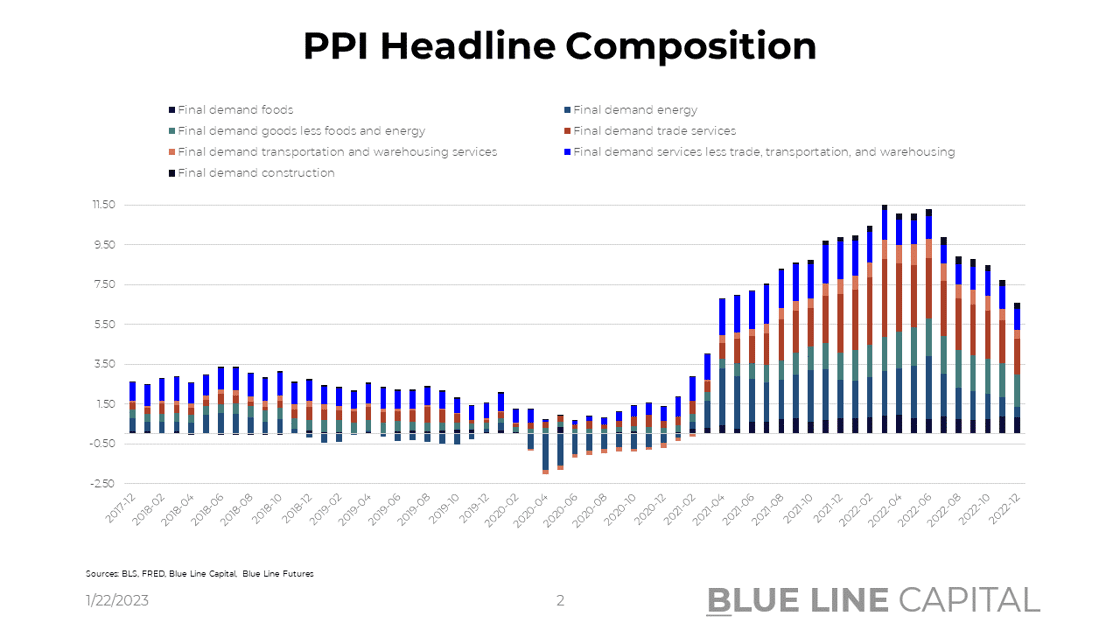
PPI at 6.3% last week continues to point south on inflation, which in conjunction with consumer price disinflation starts to paint an encouraging picture. As we had talked about last week, food remains a rather sticky aspect of inflation as companies continue to pass through price increases that occurred in 2022. Nevertheless, a rapid decline in gas prices coupled with fertilizer prices rolling over by -8% Y/Y does leave room for optimism. Energy showed the 6th consecutive month of deceleration, only accounting for 0.5% of the 6.3% headline in December. Surprising to an extent is the relative stickiness of transportation & warehousing services given companies from Amazon to FedEx have overbuilt capacity. While the component’s headline contribution of 1.03% is far off its peak at 1.94% in June 2021, labor issues in trucking coupled with more manufacturing activity in the U.S. might lead to a degree of secularly higher costs in transportation. While secular trends are important, J.B. Hunt Transportation services commented on costs in the sector during its Q4 2022 earnings call: “We see the shift occurring now where customers are putting more value on cost or how to save the money and on service quality as capacity is less difficult to source.”
Don't miss Episode 3 of our Triple Play Podcast -- Bill Baruch and Jannis Meindl share their thoughts on recent inflation data.
Employment & Growth Data
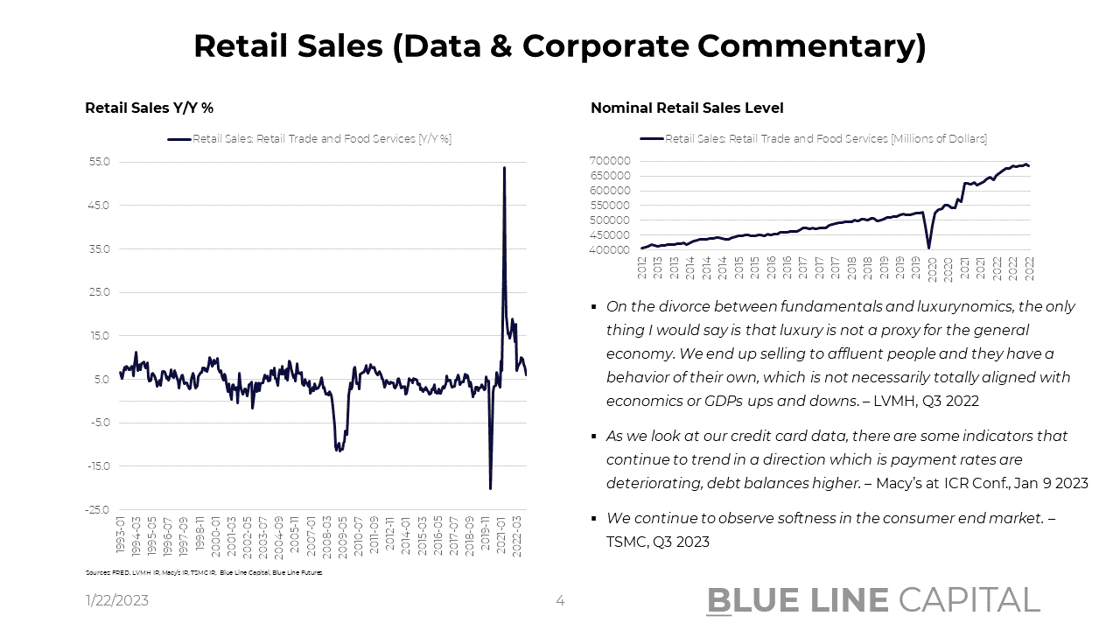
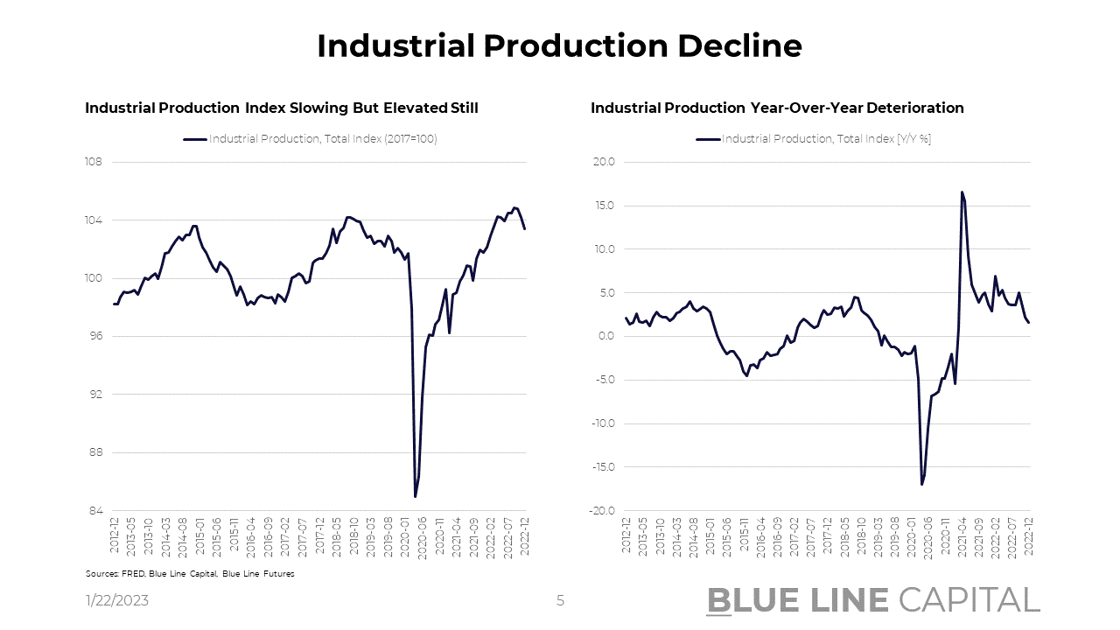
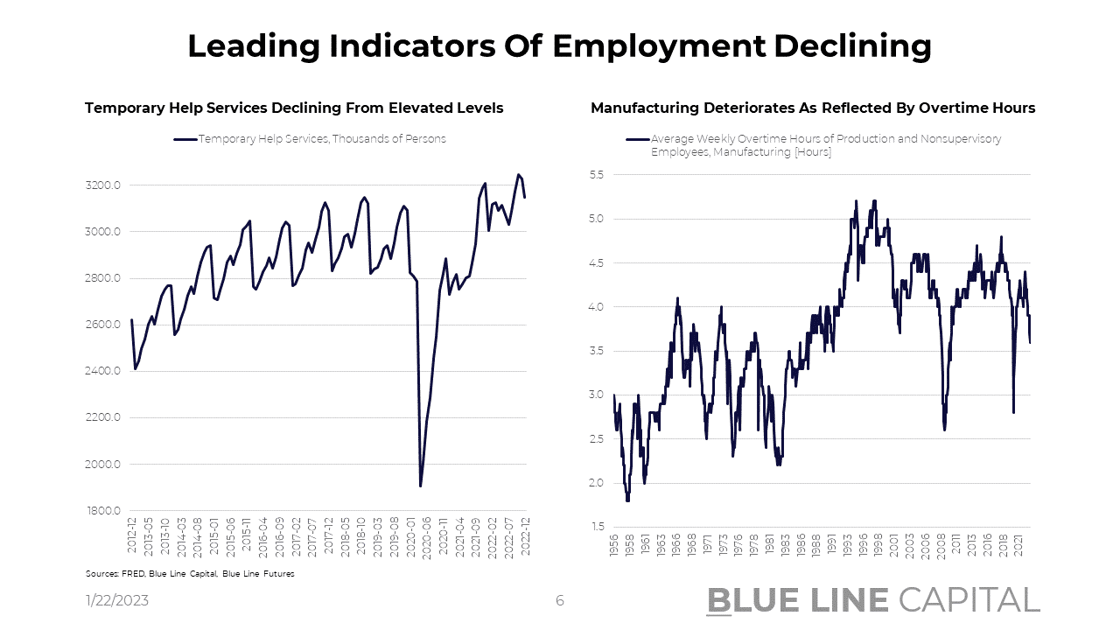
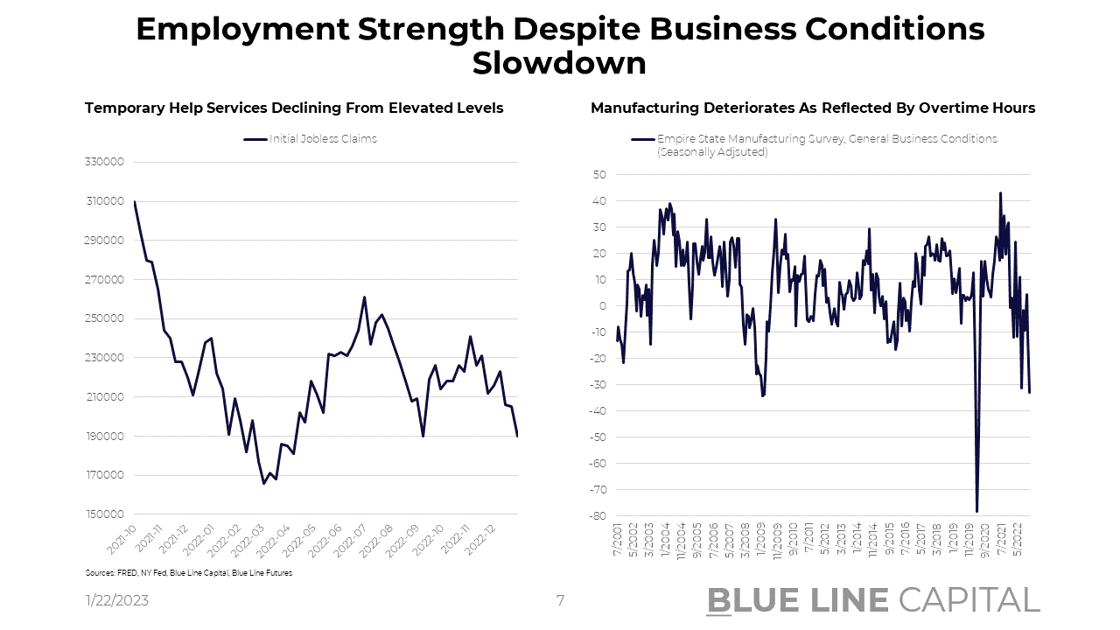
Turning to growth & employment conditions, jobless claims ticked down to 190k, again surprising on the tightness of the labor market. Contrary to initial claims, overtime in manufacturing – an indicator that should lead, - is declining. Causing the decline in manufacturing employment, the empire state manufacturing survey indicated a further decline from -11.2 in December to -32.9 in January. Although at high levels in absolute terms, industrial production also decelerated from 2.2% in November to 1.6% Y/Y in December. Encouraging on the inflation front for services, but net-negative for growth, persons in temporary help services have started to decline although there is a seasonality factor.
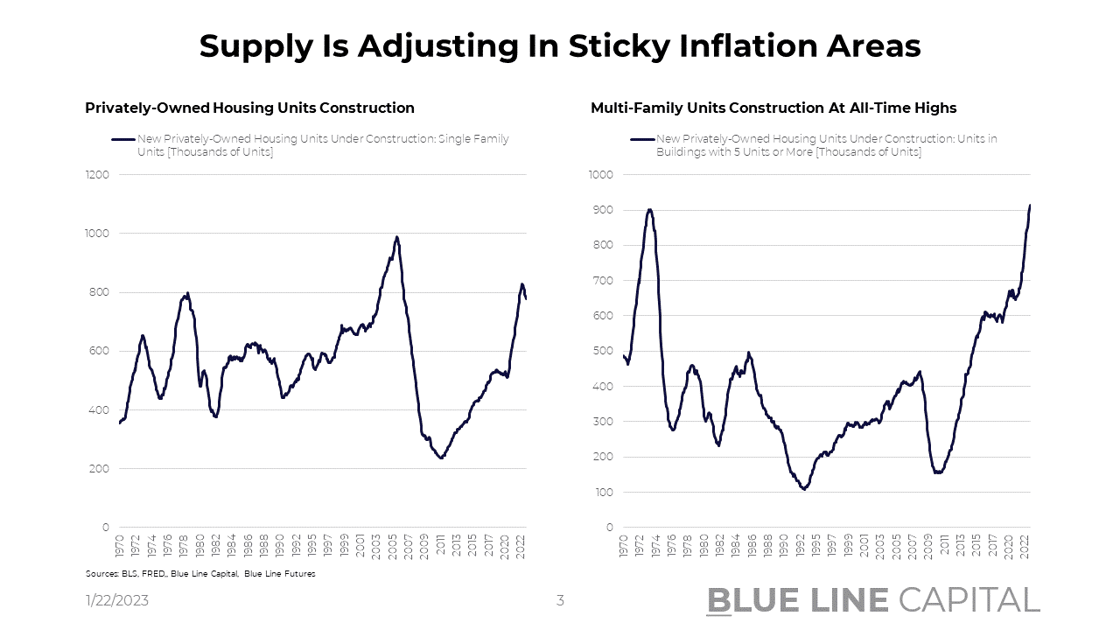
Lastly, I’d like to comment on the stickiness of shelter and housing availability. As one of the stickiest components of headline, supply of housing will be key to turn the ship. Single family homes under construction are up 50% in Nov. 2022 compared to Nov. 2019; multi-family homes under construction (5 units or more) are up 43% from 2019 levels.
Given we’ve spoken about tail-risks in energy on the back of a steep deceleration in recent months, I would like to share our crude oil, natural gas, and copper Weekly Tactical Insight reports again (sent to clients on 01-20-2023).
Commodities Commentary (Weekly Tactical Insights)
Crude Oil:
Chinese crude consumption grew at a rate of 4.8% from 2011 – 21 but was down in 2022 as imports fell by 0.9%. Oil only accounts for 19% of the country’s primary energy consumption, however, ahead of natural gas at 9%. In contrast, coal accounts for ~55%, leaving substantial room for replacement. Despite China’s plans to build 150 new nuclear reactors over the next 15 years, 53GW of existing nuclear capacity appears small relative to 70GW in thermal capacity additions in 2023 alone. While China also announced 100GW of solar and 65GW of wind additions in 2023, solar’s load factor ranges from 10-25% while wind’s is in the 30% range. As a result, gas and oil will likely keep growing at a brisk pace and expand their role as reliable baseload power. Looking at developments in the U.S., total oil production grew 7.7% Y/Y in December and is expected to grow by 10.1% in January before further accelerating to 12.6% in February. Continuing to lead production increases, the Permian is producing at a rate of 5.636m bbl/day with solid growth also coming from the Bakken region. Scott Sheffield, CEO of Pioneer Natural Resources, expects the Permian to ultimately peak at 6.5m – 7.5m bbl/day, meaning there continues to be upside. Looking for production growth, executives surveyed by the Dallas Fed signaled more willingness to spend in 2023. 25% of respondents aim to increase capital spending ‘significantly’ in 2023 with 39% of respondents planning to increase spending ‘slightly’. In the grand scheme of things, global E&P spending remains subdued relative to prior spending cycles, though. Pioneer estimates that current upstream E&P spend is 45% below 2012 – 2014 levels. Interestingly, OPEC projects its own market share to decline from 36.34% in 2022 to 35.60% in 2028. While those numbers are dynamic, it will be interesting to find out how much spare capacity is left.
Natural Gas:
With Dutch TTF trading into the mid-50s earlier this week before prices recovered to €66.50/MWh on Friday, U.S. gas exporters don’t see the type of Henry Hub prices they’d like to see. As Chesapeake CEO, Nick Dell’Osso, warned his peers this week, the industry needs to curb its enthusiasm for production increases before export capacity is ready. Looking at the cash flow statement of Range Resources, cash used for ‘additions to natural gas properties’ increased from $311m in the first 9 months of 2021 to $351m in 2022 (2021 full year $393m). Compared to RRC’s $405m in 2020 and $687m in 2019, however, the natural gas operator does appear to be a disciplined allocator of resources. Capital expenditures of EQT increased from ~$707m in the first 9 months of 2021 to $1.05bn over the same period in 2022. Again, comparatively to pre-2020, these are still subdued spending numbers. Both RRC and EQT benefit from tremendous cost efficiencies and volume growth in the Appalachian basin (Marcellus region.) Overall production volume from Appalachia was down -2.78% Y/Y in December but is expected to accelerate to +4% in January and +5% in February. Also a leader in overall production growth, the Permian is expected to increase natural gas production by 14% Y/Y in January and 15% in February. Overall, month/month production increases are running at ~0.5% in recent months with Y/Y expected at +10% in the first two months of the year. Turning to technicals, managed money is -87,278 net short, the most short managed money has been since early 2020.
Copper:
Flipping the order around this week, let’s start with U.S. economic data. Industrial production slowed from 2.18% Y/Y in November to 1.65% Y/Y in December (-0.7% M/M, down from -0.6%). Interestingly, despite overtime hours in manufacturing slowing along with temporary services help indicating the onset of a slowdown, initial jobless claims decreased further to 190k. The lack of loosening in the labor market stands in stark contrast to headline news about tech layoffs, which in the aggregate are a small portion of the overall job market. On Thursday, the Philly Fed’s General Activity Diffusion Index climbed from -13.7 in December to -8.9 in January. Turning the discussion to China, Liu He told the world in Davos that “China is back”, further reversing course on the last 3 years of policy. While foreign direct investment was reported to be 29% lower Y/Y in December, Beijing appears to put more emphasis on collaboration over confrontation. Some commentators have compared the message from China’s Vice Premier to Xi Jinping’s 2017 speech where he also advocated for globalization. While the Chinese economy grew at the slowest pace in 50 years, Y/Y retail sales surprised positively at -1.8% Y/Y compared to -9.5% expected. Y/Y industrial production also surprised on the upside at +1.3% Y/Y compared to 0.2% expected. Given that weak consumption is China’s real problem, it will be interesting to see consumption behaviors as home prices fell for the 16th month in a row ahead of Lunar New Year.
Chart-Pack Macro Slides
Stay tuned for Episode 4 of Triple Play!
Until next time, good luck & good trading.
Be sure to check out prior writing of Top Things to Watch this Week:
- A Renormalization on Wall Street - January 16, 2023
- What Cards Does Wall Street Hold? - January 9, 2023
- Risk Assets In The Context Of China Reopening & US Macro Data - January 1, 2023
|
Our Blue Line Futures Trade Desk is here to talk about positioning, idea and strategy generation, assisted accounts, and more! Don't miss our daily Research with actionable ideas (Click Here To Sign Up) |
Economic Calendar
U.S.

Data Release Times (C.T.)
China
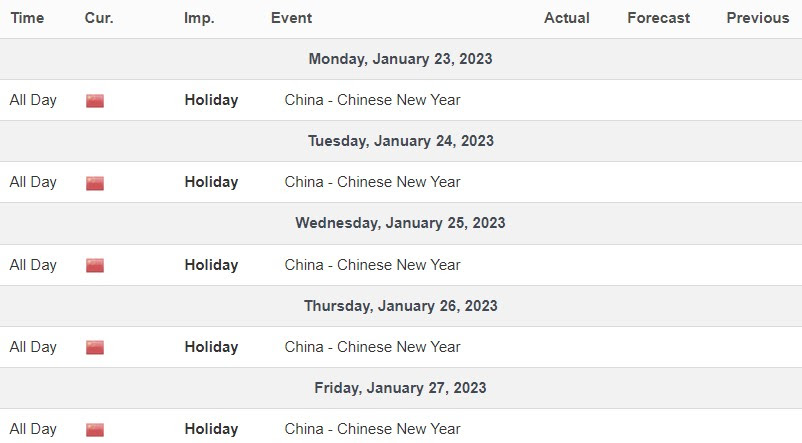
Data Release Times (C.T.)
Eurozone
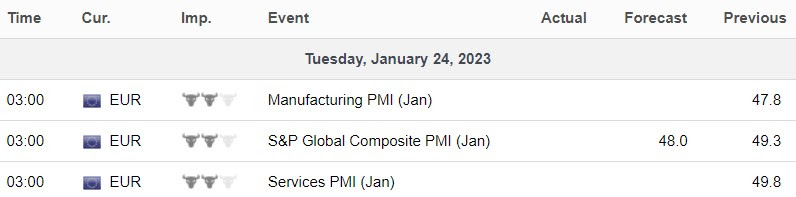
Data Release Times (C.T.)
More Of The Upcoming Economic Data Points Can Be Found Here.
Food for Thought
Blue Line Capital
If you have questions about any of the earnings reports, our wealth management arm, Blue Line Capital, is here to discuss! Email info@bluelinecapllc.com or call 312-837-3944 with any questions! Visit Blue Line Capital's Website
Sign up for a 14-day, no-obligation free trial of our proprietary research with actionable ideas!
Free Trial
Start Trading with Blue Line Futures
Subscribe to our YouTube Channel
Email info@Bluelinefutures.com or call 312-278-0500 with any questions -- our trade desk is here to help with anything on the board!
Futures trading involves substantial risk of loss and may not be suitable for all investors. Therefore, carefully consider whether such trading is suitable for you in light of your financial condition. Trading advice is based on information taken from trade and statistical services and other sources Blue Line Futures, LLC believes are reliable. We do not guarantee that such information is accurate or complete and it should not be relied upon as such. Trading advice reflects our good faith judgment at a specific time and is subject to change without notice. There is no guarantee that the advice we give will result in profitable trades. All trading decisions will be made by the account holder. Past performance is not necessarily indicative of future results.
Blue Line Futures is a member of NFA and is subject to NFA’s regulatory oversight and examinations. However, you should be aware that the NFA does not have regulatory oversight authority over underlying or spot virtual currency products or transactions or virtual currency exchanges, custodians or markets. Therefore, carefully consider whether such trading is suitable for you considering your financial condition.
With Cyber-attacks on the rise, attacking firms in the healthcare, financial, energy and other state and global sectors, Blue Line Futures wants you to be safe! Blue Line Futures will never contact you via a third party application. Blue Line Futures employees use only firm authorized email addresses and phone numbers. If you are contacted by any person and want to confirm identity please reach out to us at info@bluelinefutures.com or call us at 312- 278-0500
Like this post? Share it below:
Back to Insights
In case you haven't already, you can sign up for a complimentary 2-week trial of our complete research packet, Blue Line Express.
Free Trial