
A Renormalization on Wall Street | Top Things to Watch this Week
Posted: Jan. 16, 2023, 7:07 p.m.
A Renormalization on Wall Street
"In the world of investing perception often swings from flawless to hopeless." - Howard Marks
Chart Booklet
Access this week's chart booklet leading with a decomposition of the latest CPI report. We also cover in-depth corporate trends as we share insights on Synopsys, Wells Fargo and Boeing.
Triple Play Podcast
Don't miss the second episode of our Triple Play Podcast! Bill Baruch and Jannis Meindl talk about the latest wage data from Nonfarm Payrolls in connection to actionable stock ideas.
CPI Inflation Data & Commodities Commentary
CPI Report Commentary
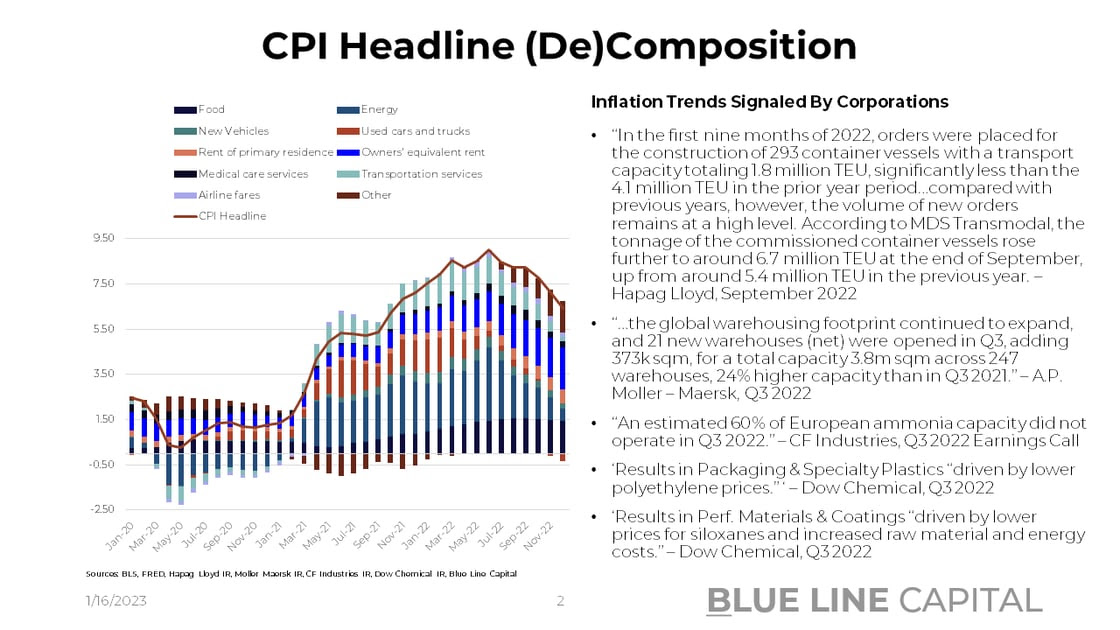
After a goldilocks jobs report, the deflation train kept on moving with CPI last week. M/M headline came in at -0.1% while core remained stickier at +0.3%. On a yearly comparison, that puts headline at 6.5% and core at 5.7%.
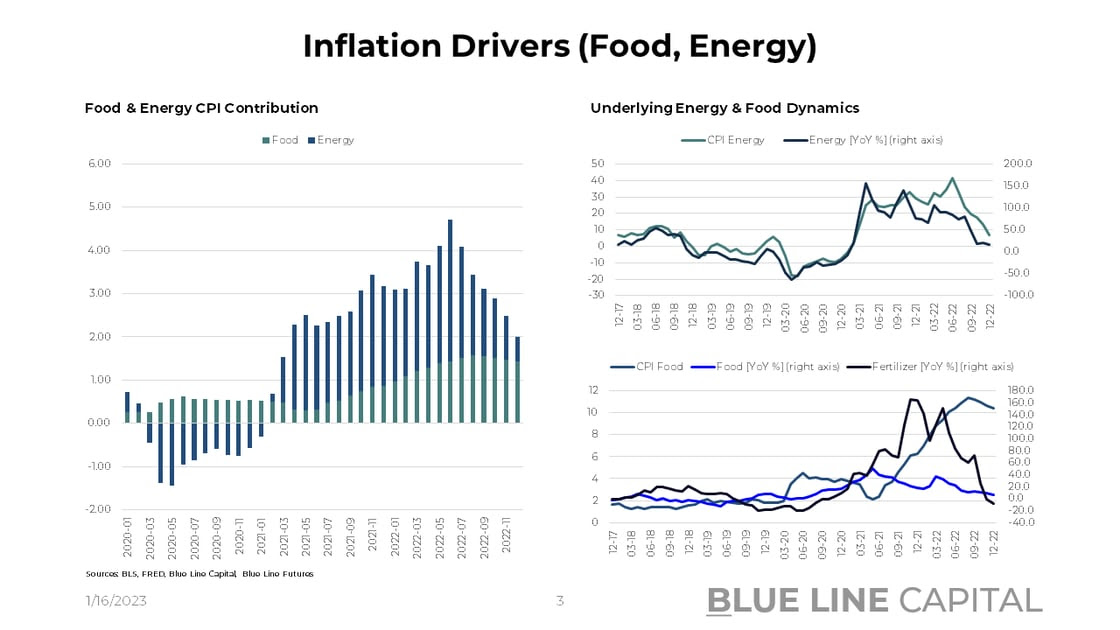
Putting upward pressure on headline, food prices remain very elevated at 10.4% Y/Y. We've all seen headlines on egg prices moving substantially higher and those trends are getting reflected. Arguably, we are witnessing the last few innings of the producer-consumer flow through as overall food & fertilizer prices see a substantial Y/Y deceleration (slide 3 of our chart-pack.) Nevertheless, the direction of travel is encouraging given the report gave us the 4th sequential slowdown of the food component's contribution to headline. Energy, which peaked at a 3.27% Y/Y contribution to headline in June, contributed 0.55% to headline.
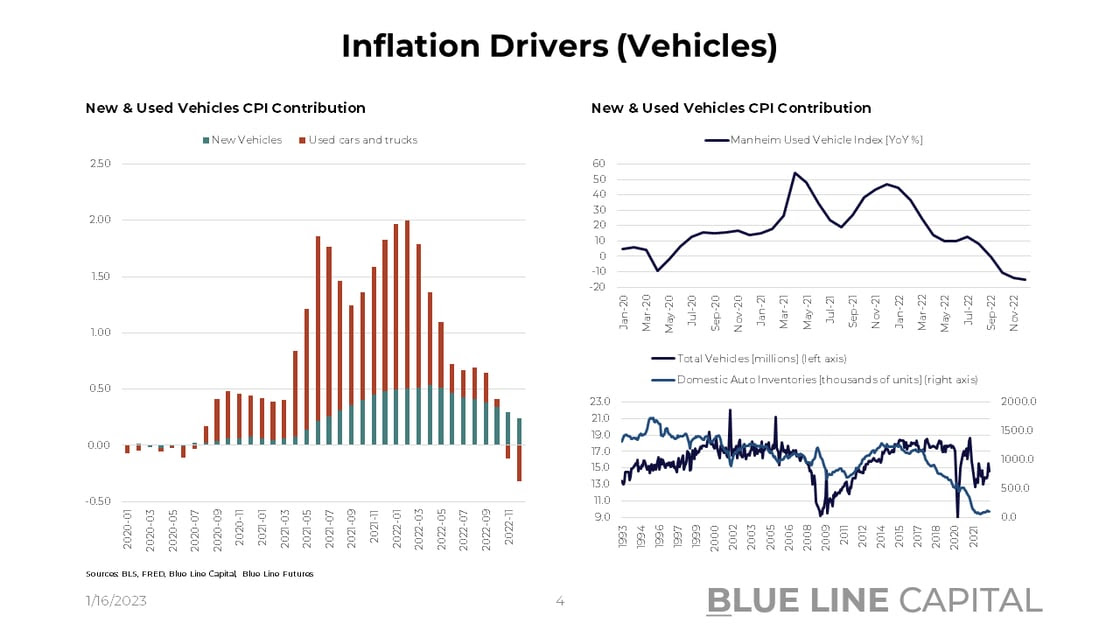
Also encouraging, new vehicles slowed for the 8th consecutive month on a Y/Y basis with used cars & trucks moving into outright deflation (-8.8%). The dynamic reflected in CPI is very much in line with Manheim prices at -14.9% Y/Y in December.
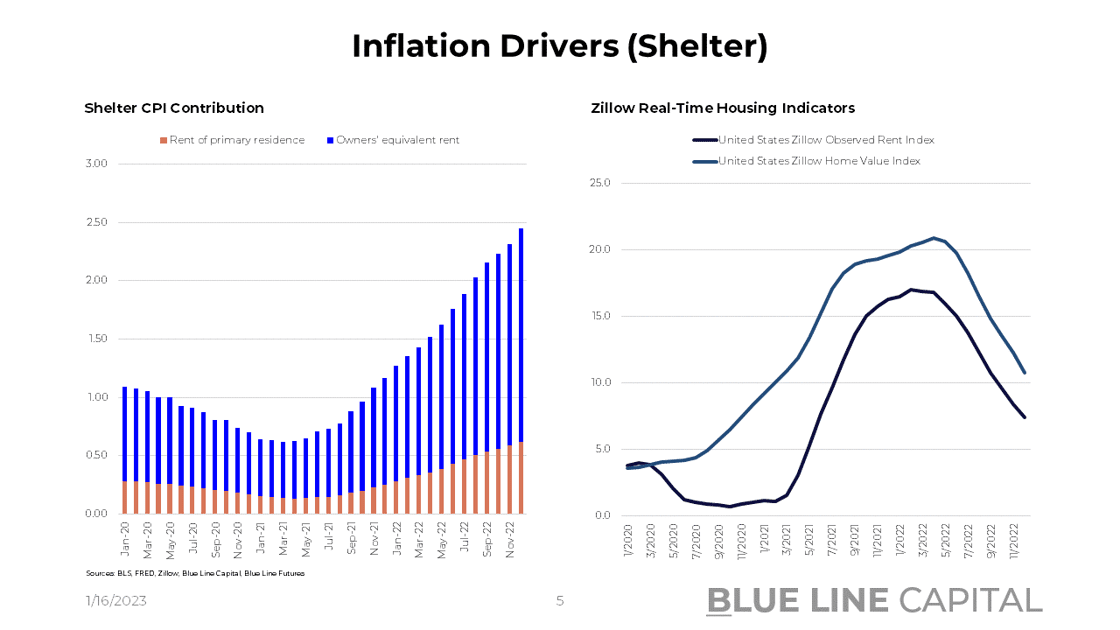
On the more resilient side also driving core inflation, shelter continues to accelerate despite new rents rolling over significantly. Now, why do we see the 17th consecutive acceleration in rent of primary residence and the 20th consecutive increase in headline contribution of owners' equivalent rent? First and foremost, tenants renew their contracts fairly infrequently, which means we are still resetting rents that may have gotten set 2 years ago. As a result, we're moving to vastly higher nominal levels. Second, shelter is calculated on a rolling average basis, which means higher numbers take time to flow into shelter's contribution.
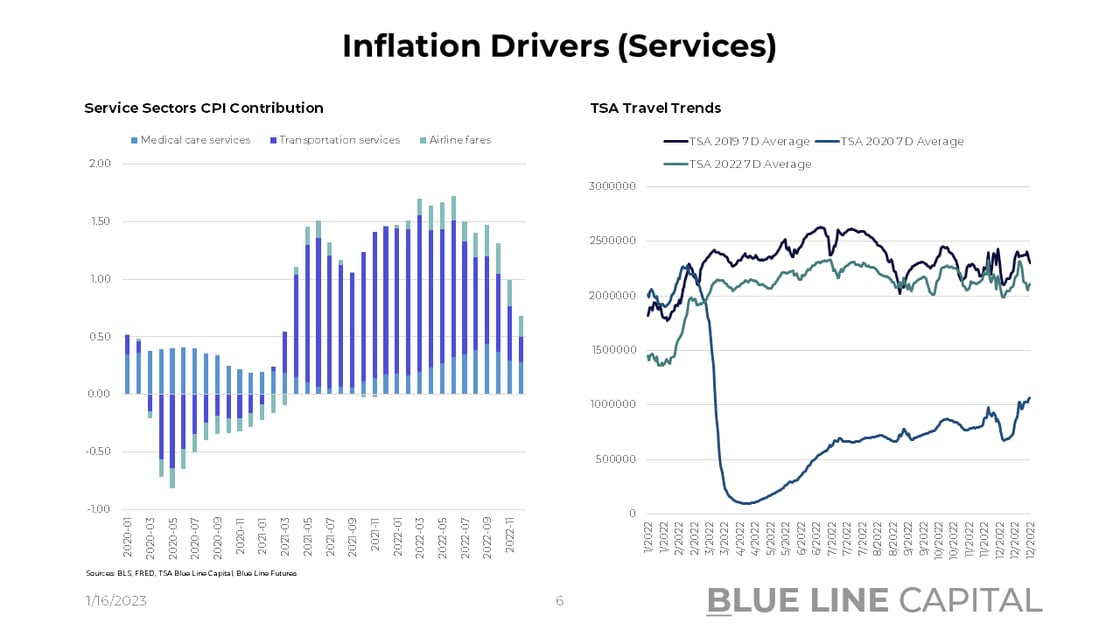
Again, on the bright side of inflation, medical care services, transportation, and airfares are all decelerating. In December airfares showed a Y/Y increase of 28.5%, down from 42.9% in September (airfares only account for 0.63% of headline). Medical care services weighted at ~6.8% of headline also decelerated from 6.5% in September to 4.1% last month. Transportation services peaked at 22.5% in March, now down to 3.7% Y/Y. The December CPI print in conjunction with ISM Services in contraction at 49.6% does paint an encouraging picture despite resilient wage pressures in areas of the economy (employment 49.8%; supplier delivery 48.5%).
Don't miss Episode 2 of our Triple Play Podcast -- Bill Baruch and Jannis Meindl talk about the great resignation, distortions in the labor data, and much more.
China Reopening & Commodities Commentary
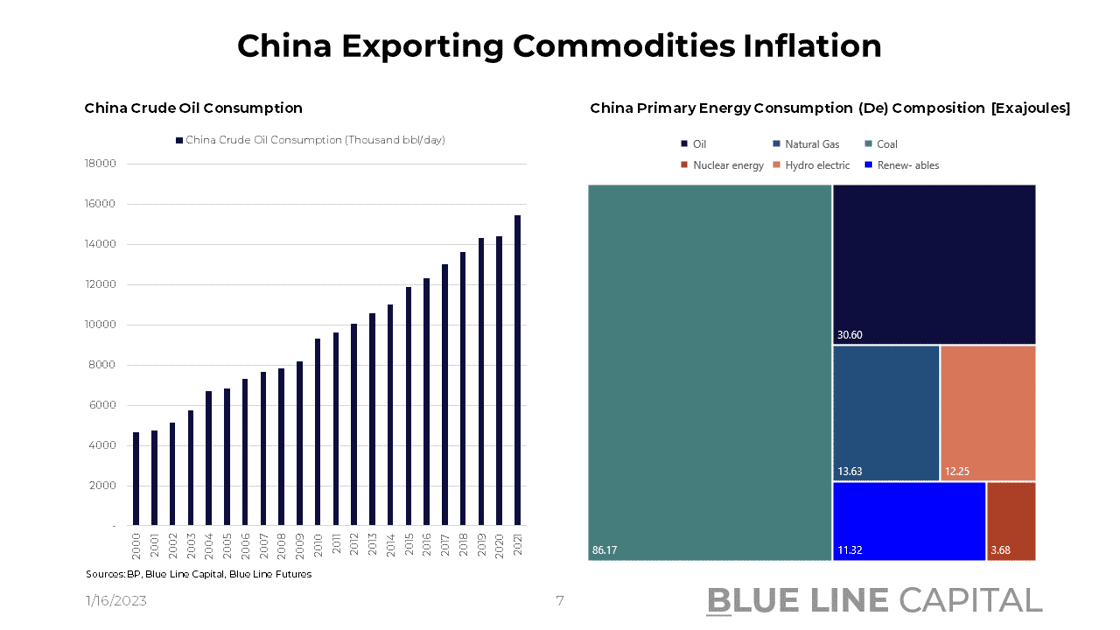
We've put more emphasis on the China reopening as a driver for commodities recently. According to BP's annual statistical review, China consumed 15.4m bbl of crude per day in 2021, showing an annual growth rate of 4.8% from 2011-21. Goldman estimates that current oil prices are reflective of 14m bbl/day, 500k below their 6-month forecast.
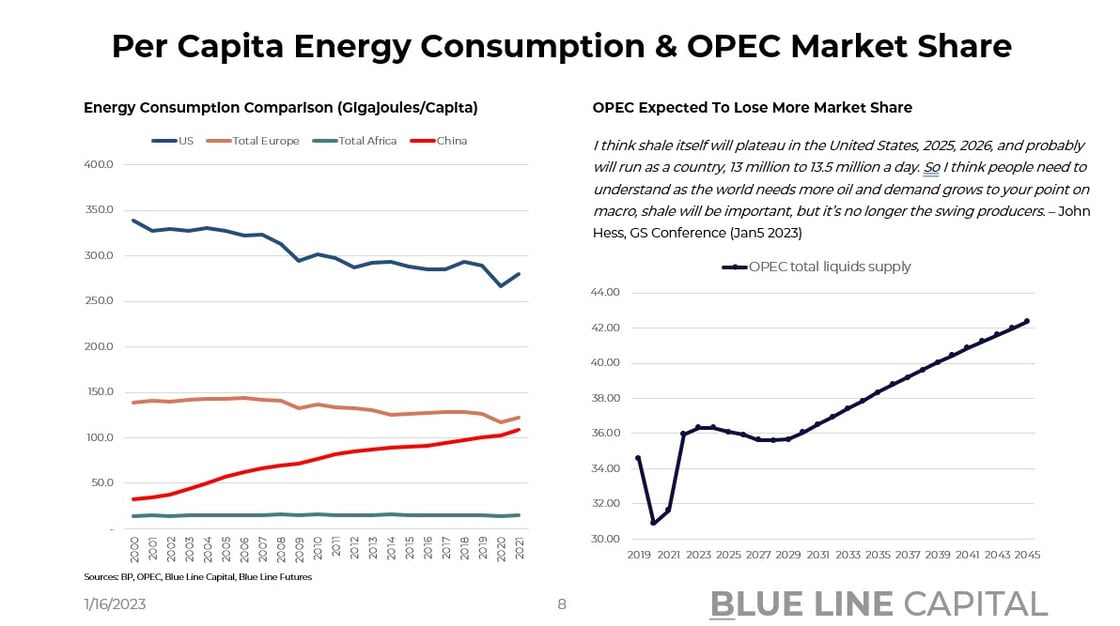
More importantly, though, crude only accounts for 19.4% of China's total primary energy consumption while coal accounts for 54.7%. Natural gas merely at 8.6%. As a result, there's significant replacement potential as China aims to import more crude from its neighbor, Russia, while continuing its strategic engagement with Saudi Arabia. As OPEC market share of total supply continues to drift lower over the coming years (according to OPEC's forecast), it will be crucial to monitor whether there'll be a new swing producer cushioning higher demand. In the absence of a swing producer, we might face a volatile environment for various commodities.
In our Weekly Tactical Insights series, we share fundamental commentary on crude, natural gas, and copper. We thought it would make sense to share the latest with you here.
Crude Oil:
In a chart-pack from two weeks ago, we started to point to a pivot from Beijing in two arenas: the first pertaining to an accelerated reopening out of Covid-Zero, and the second in regards to a strategic reset in the world of geopolitics. As former PM of Australia Kevin Rudd emphasized at an event of the Asia Society, Xi Jinping’s speech at the G20 in Bali marked a shift in rhetoric towards geostrategic adversaries. Xi’s speech was later followed by China’s foreign minister Qin Gang who talked about “being deeply impressed” by his time in Washington. This is a 180 on multiple fronts and it marks a pivotal change in the demand landscape for commodities. Unlike western nations that responded with demand stimulation during the heights of Covid, Beijing mostly based its response on societal measures. As a result, more accommodative policies can be used in lieu of the current reopening and thereby lead to increased consumption. What’s more, John Hess from Hess Corp recently suggested that he sees U.S. production plateauing in 2025/26 at around 13 – 13.5m bbl/day (up from the current 12.2m.) With little spare capacity from OPEC+ and questionable production stability from Russia (Urals trading at ½ of Brent), there’s no reliable swing producer. Thus, while the recession conversation in the western world may adversely affect upside price swings, a return of global travel combined with underinvestment could lead to a material change of the supply/demand balance.
Natural Gas:
In 2019, the EU imported more than 50% of natural gas from Russia. As of August 2022, the dependency was reduced to 17.2% with further decreases later in the year as pipeline flows went as low as 1.8bcm/month in December. Simultaneously, US LNG imports increased from 0.65bcm/month in early 2021 to over 4bcm in August 2022. A global supply response combined with a demand reduction of 23.6% by the EU in November puts the continent in a rather comfortable position; according to internal calculations using BP data, this puts the EU on a sub 300bcm/annum run-rate of consumption. As a result, European gas storage levels are comfortably above the 5-year average, leading to Dutch TTF trading down to €62/MWh. To put things into context, Dutch TTF traded in the mid €350/MWh back in August. While trading at a discount for the better part of 2022, JKM prices are now at premium to TTF (Korea/Japan benchmark). Hence, we are now in a position where American producers are eagerly awaiting an increase in US export capacity through 2026 with more production also coming from nations like Qatar, Algeria, and Norway. Also in the mix, China natural gas consumption was down in 2022, which helped fill the void for Europe.
Copper:
After a year of tremendously restrictive Covid-policy, China is on the move again ahead of Lunar New Year. Traffic congestion across China’s major cities is rapidly rising along with a geostrategic shift in rhetoric towards foreign nations. What seemed like a new Cold War era around the 20th People’s Party Congress has turned into a change in tone at the G20 Summit in Bali. Xi Jinping didn’t only speak about the establishment of guardrails around the US-China relationship, but also flipped a switch domestically. While CCP leadership continues to prioritize a concept known as “common prosperity”, there’s certainly less emphasis on ideology compared to a few months ago. Given China consumes ~50% of the world’s copper with 20-30% of the economy dependent on real estate, the path of the reopening will be critical for price prospects. After a memorable and consequential year where Beijing reset the country’s social contract, renewable initiatives across the west will grow in importance too. Along with a supply deficit in the middle of this decade, the IEA estimates that clean energy technologies will require 2.1-3.4x as much copper in 2050 relative to 2020. Thus, while China demand will likely drive price action, economic health in the west and renewables demand will be important too. For more commentary on China, check out our Triple Play podcast.
Chart-Pack
CPI slides on page 2 - 6.
China commodities demand & OPEC market share on slides 7 - 8.
The rest on corporate developments from semiconductors to airplanes.
Don't miss our weekly chart pack and stay tuned for Episode 3 of Triple Play!
Until next time, good luck & good trading.
Be sure to check out prior writing of Top Things to Watch this Week:
- What Cards Does Wall Street Hold? - January 9, 2023
- Risk Assets In The Context Of China Reopening & US Macro Data - January 1, 2023
- The State Of Corporate America - December 27, 2022
Our Blue Line Futures Trade Desk is here to talk about positioning, idea and strategy generation, assisted accounts, and more! Don't miss our daily Research with actionable ideas (Click Here To Sign Up)
Schedule a Consultation or Open your free Futures Account today by clicking on the icon above or here. Email info@BlueLineFutures.com or call 312-278-0500 with any questions!
Economic Calendar
U.S.
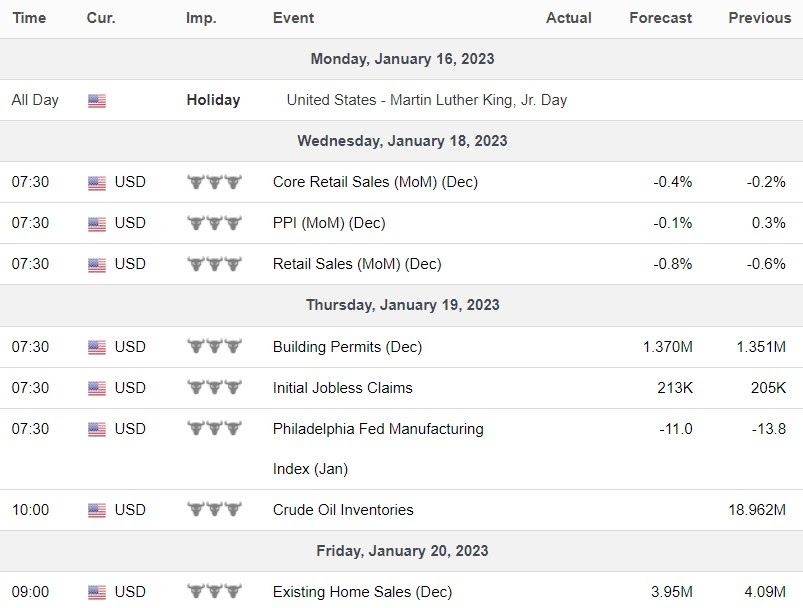
Data Release Times (C.T.)
China
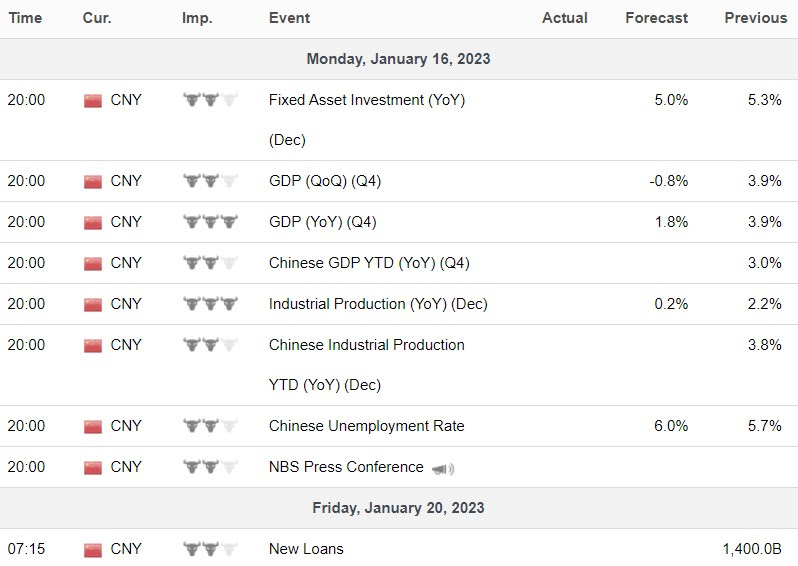
Data Release Times (C.T.)
Eurozone
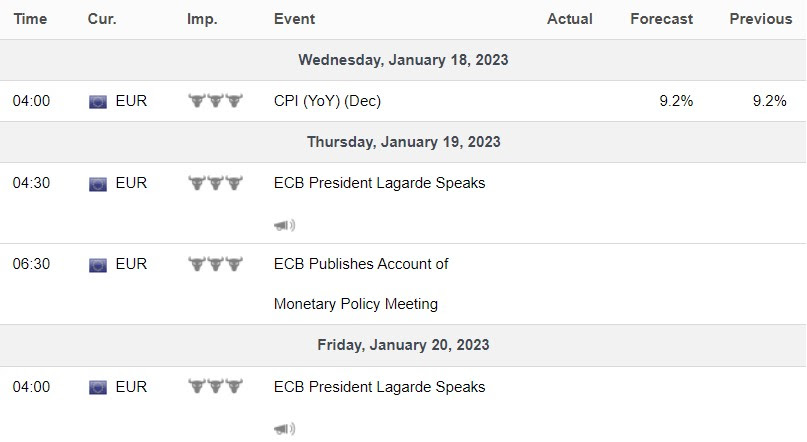
Data Release Times (C.T.)
More Of The Upcoming Economic Data Points Can Be Found Here.
Food for Thought
Blue Line Capital
If you have questions about any of the earnings reports, our wealth management arm, Blue Line Capital, is here to discuss! Email info@bluelinecapllc.com or call 312-837-3944 with any questions! Visit Blue Line Capital's Website
Sign up for a 14-day, no-obligation free trial of our proprietary research with actionable ideas!
Free Trial
Start Trading with Blue Line Futures
Subscribe to our YouTube Channel
Email info@Bluelinefutures.com or call 312-278-0500 with any questions -- our trade desk is here to help with anything on the board!
Futures trading involves substantial risk of loss and may not be suitable for all investors. Therefore, carefully consider whether such trading is suitable for you in light of your financial condition. Trading advice is based on information taken from trade and statistical services and other sources Blue Line Futures, LLC believes are reliable. We do not guarantee that such information is accurate or complete and it should not be relied upon as such. Trading advice reflects our good faith judgment at a specific time and is subject to change without notice. There is no guarantee that the advice we give will result in profitable trades. All trading decisions will be made by the account holder. Past performance is not necessarily indicative of future results.
Blue Line Futures is a member of NFA and is subject to NFA’s regulatory oversight and examinations. However, you should be aware that the NFA does not have regulatory oversight authority over underlying or spot virtual currency products or transactions or virtual currency exchanges, custodians or markets. Therefore, carefully consider whether such trading is suitable for you considering your financial condition.
With Cyber-attacks on the rise, attacking firms in the healthcare, financial, energy and other state and global sectors, Blue Line Futures wants you to be safe! Blue Line Futures will never contact you via a third party application. Blue Line Futures employees use only firm authorized email addresses and phone numbers. If you are contacted by any person and want to confirm identity please reach out to us at info@bluelinefutures.com or call us at 312- 278-0500
Like this post? Share it below:
Back to Insights
In case you haven't already, you can sign up for a complimentary 2-week trial of our complete research packet, Blue Line Express.
Free Trial
